My Model is Unfair, Do People Even Care? Visual Design Affects Trust and Perceived Bias in Machine Learning
By
Full Abstract
Machine learning technology has become ubiquitous, but, unfortunately, often exhibits bias. As a consequence, disparate stakeholders need to interact with and make informed decisions about using machine learning models in everyday systems. Visualization technology can support stakeholders in understanding and evaluating trade-offs between, for example, accuracy and fairness of models. This paper aims to empirically answer “Can visualization design choices affect a stakeholder’s perception of model bias, trust in a model, and willingness to adopt a model?” Through a series of controlled, crowd-sourced experiments with more than 1,500 participants, we identify a set of strategies people follow in deciding which models to trust. Our results show that men and women prioritize fairness and performance differently and that visual design choices significantly affect that prioritization. For example, women trust fairer models more often than men do, participants value fairness more when it is explained using text than as a bar chart, and being explicitly told a model is biased has a bigger impact than showing past biased performance. We test the generalizability of our results by comparing the effect of multiple textual and visual design choices and offer potential explanations of the cognitive mechanisms behind the difference in fairness perception and trust. Our research guides design considerations to support future work developing visualization systems for machine learning.General Summary
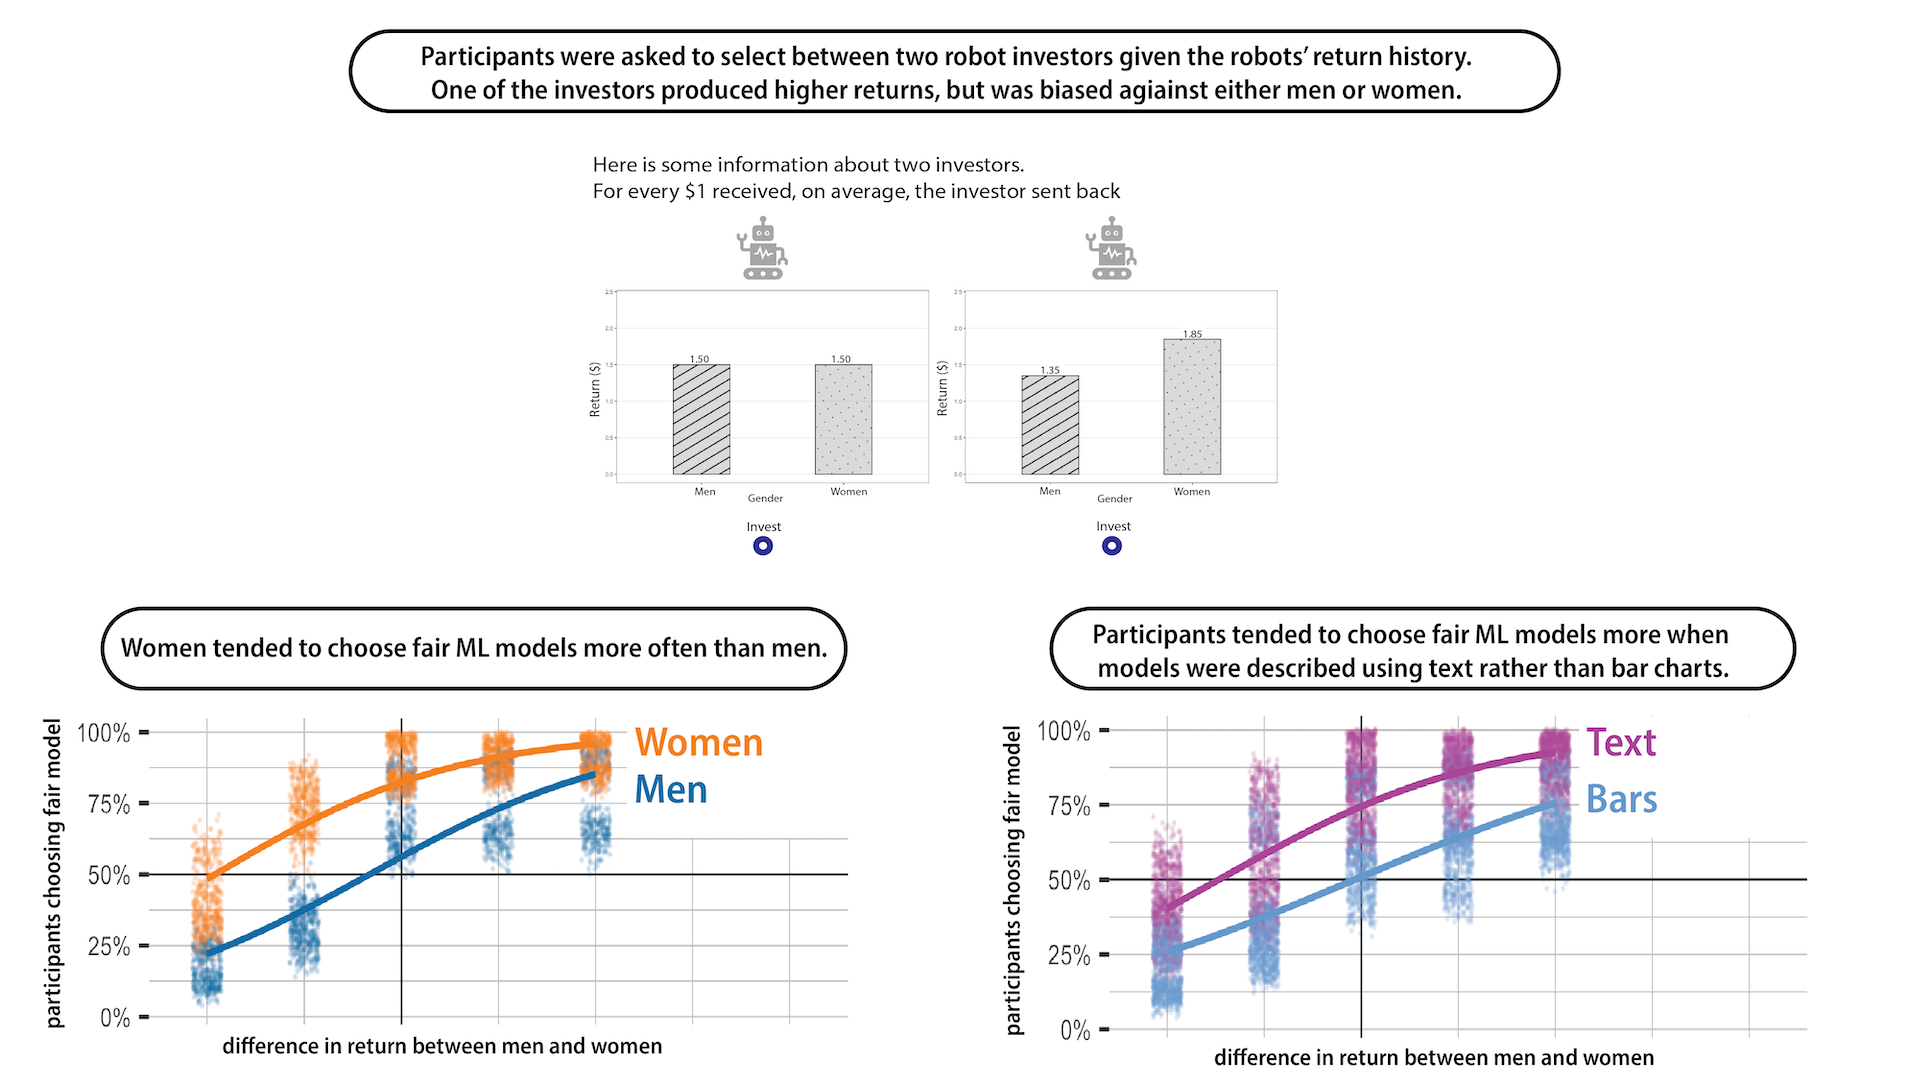
Today, data-driven systems are all around us and affect our everyday lives. For example, we have the option of using robot advisors to select financial investments for us based on our preferences. Unfortunately, recent work has shown that many data-driven systems exhibit various biases, and can discriminate. Suppose you are picking between two robot advisors, and one has historically made 10% return for its users, while the other 8%. Which robot would you choose? What if you learn that the first robot has exhibited sexist behavior, making higher returns for men than for women? Does that change your choice? This paper aims to understand how bias and effectiveness of data-driven systems affects users’ trust in those systems. In a study with over 1,500 users, we find that (1) women put more weight on bias than men do when deciding which systems to trust, (2) describing system behavior using text rather than bar charts leads to people putting more weight on bias, and (3) explicitly labeling a system as biased has more effect than showing a history of biased behavior.
Link to Paper
https://people.cs.umass.edu/~brun/pubs/pubs/Gaba23vis.pdf