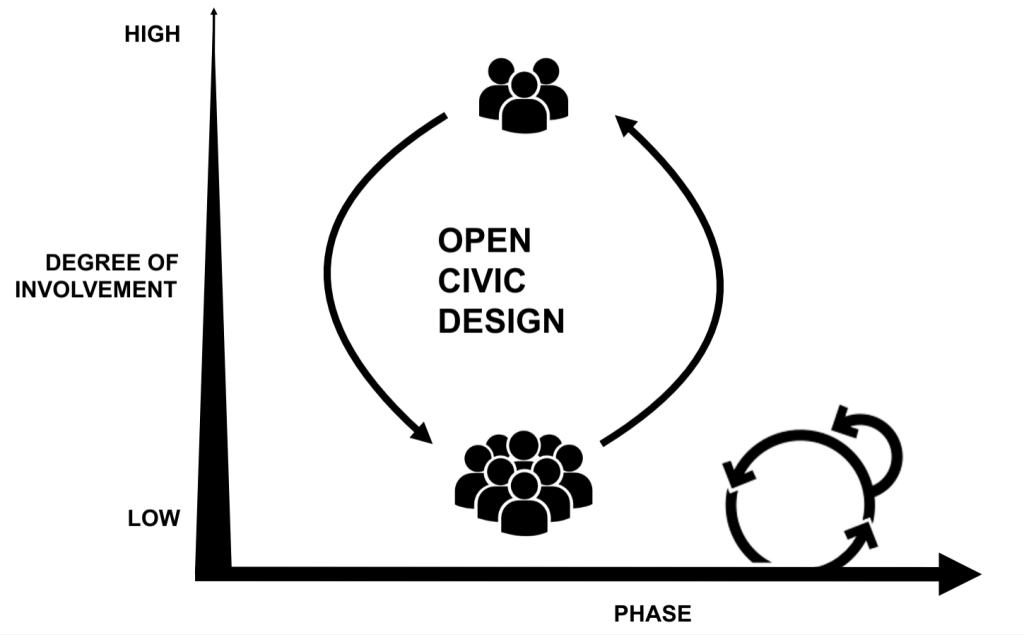
Framework for Open Civic Design
Led by: Brandon Reynante, Steven P. Dow, and Narges Mahyar
Related Papers:
 “A Framework for Open Civic Design: Integrating Public Participation, Crowdsourcing, and Design Thinking”
Civic problems are often too complex to solve through traditional top-down strategies. Various governments and civic initiatives have explored more community-driven strategies where citizens get involved with defining problems and innovating solutions. While certain people may feel more empowered, the public at large often does not have accessible, flexible, and meaningful ways to engage. Prior theoretical frameworks for public participation typically offer a one-size-fits-all model based on face-to-face engagement and fail to recognize the barriers faced by even the most engaged citizens. In this article, we explore a vision for open civic design where we integrate theoretical frameworks from public engagement, crowdsourcing, and design thinking to consider the role technology can play in lowering barriers to large-scale participation, scaffolding problem-solving activities, and providing flexible options that cater to individuals’ skills, availability, and interests. We describe our novel theoretical framework and analyze the key goals associated with this vision: (1) to promote inclusive and sustained participation in civics; (2) to facilitate effective management of large-scale participation; and (3) to provide a structured process for achieving effective solutions. We present case studies of existing civic design initiatives and discuss challenges, limitations, and future work related to operationalizing, implementing, and testing this framework.