Digital Civics
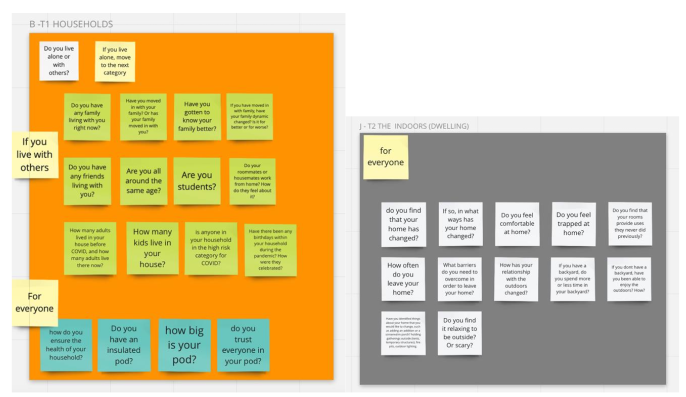
Mapping Instability
The Effects of the Pandemic on the Civic Life of a Small Town
AMPS Health and Design Network 2022
Read More |  Full Paper
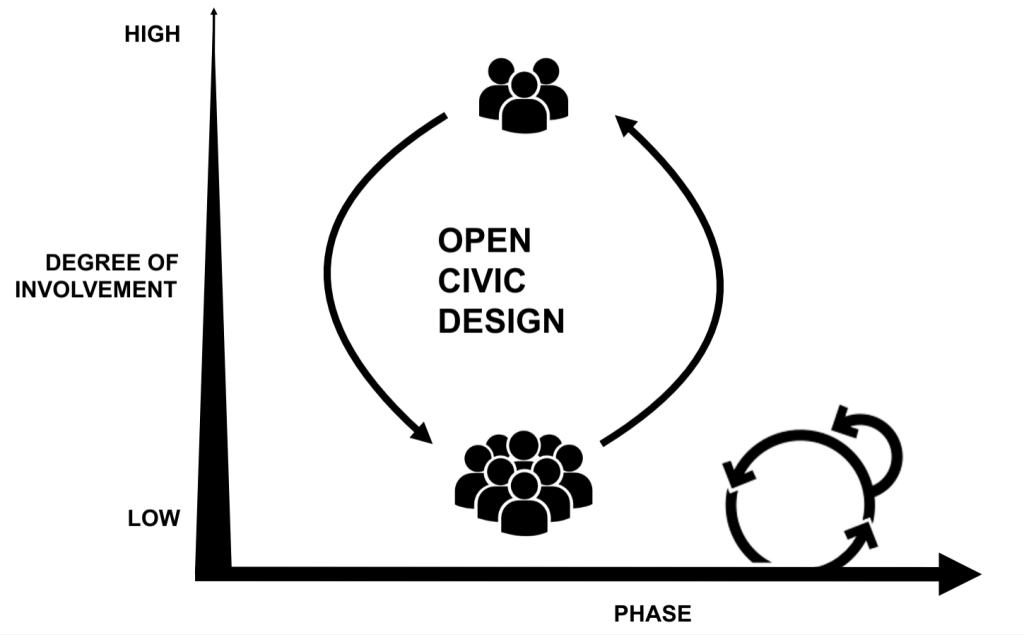
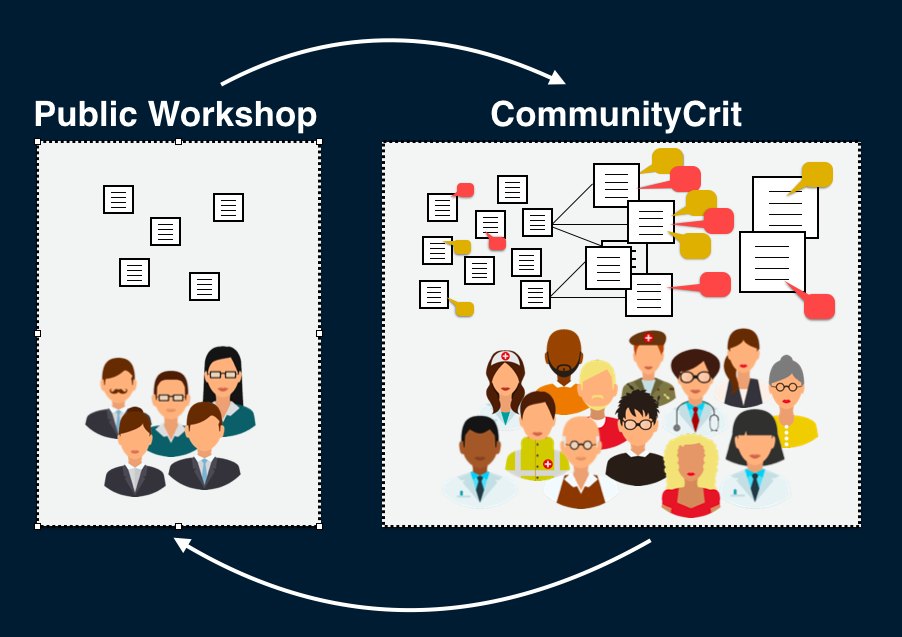
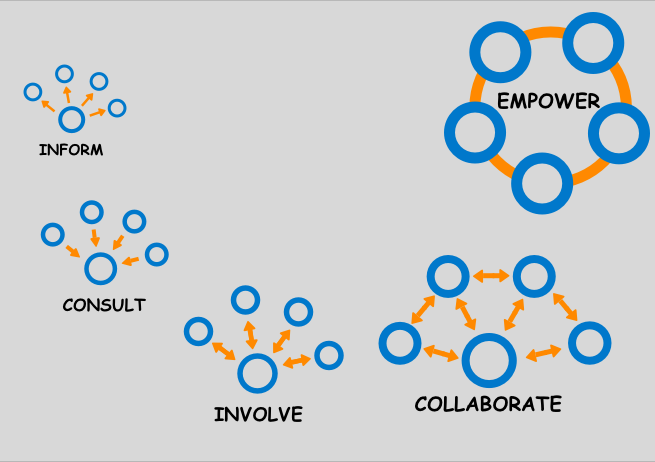
Framework for Open Civic Design
Integrating public participation, crowdsourcing, and design thinking
ACM Digital Gov 2021
Read More | Full Paper
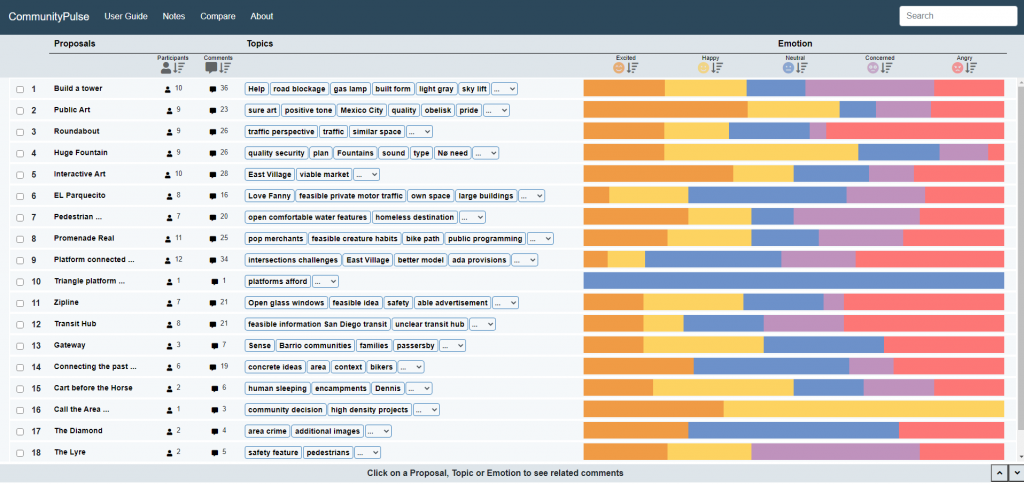
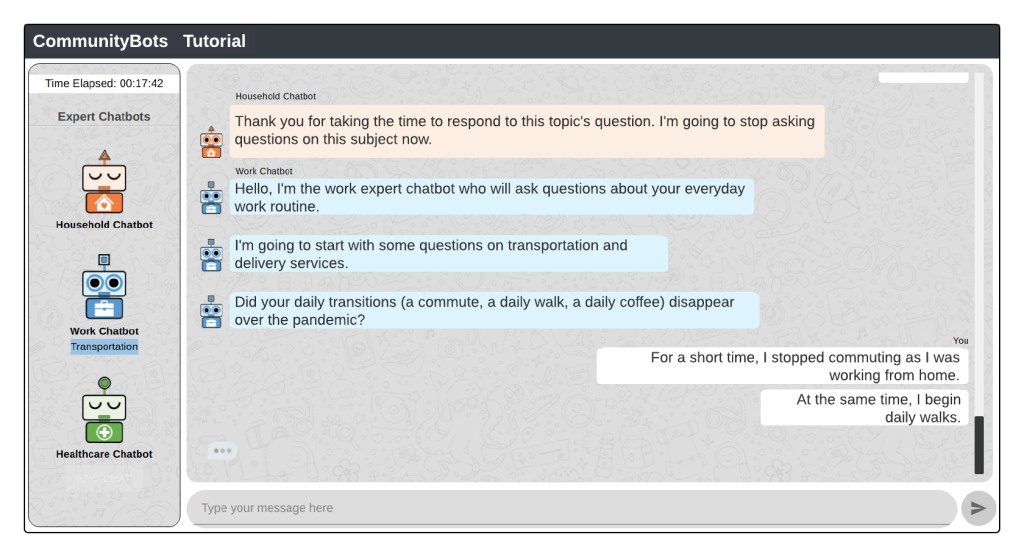
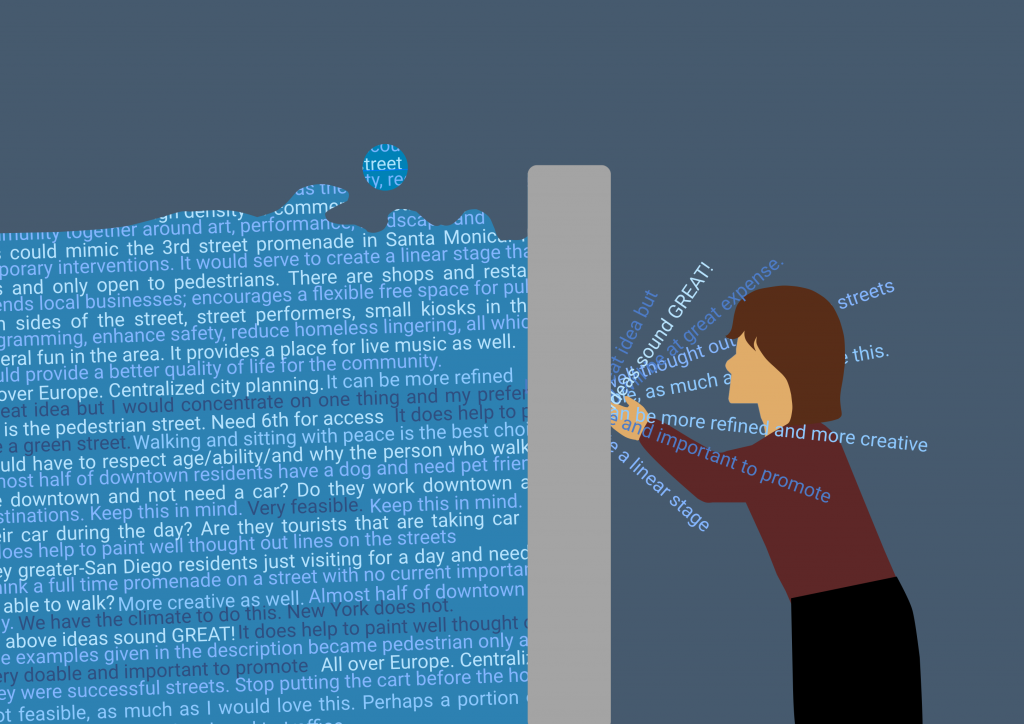
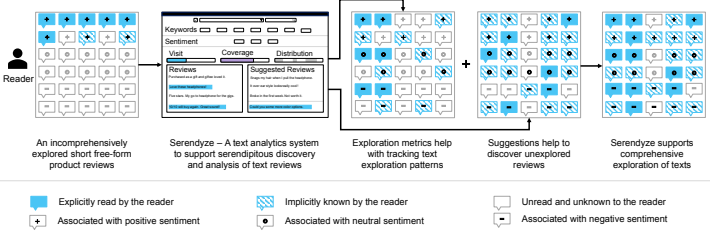
CommunityPulse
Combining text analysis and visualization to scaffold different facets of community input
DIS 2021
Read More | Full Paper |  Video
Video

 Website
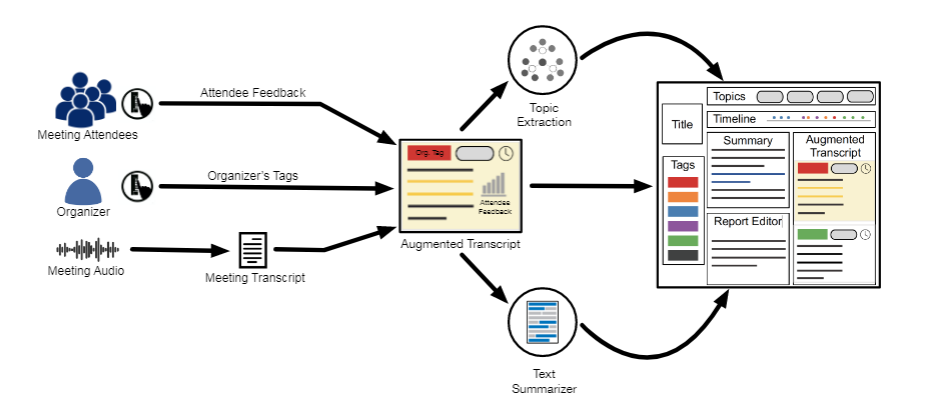
CommunityClick
Capturing and reporting community feedback from town halls to improve inclusivity
CSCW 2020
Read More | Full Paper | Demo Paper | Talk

UD Co-Spaces (Urban Design Collaborative Spaces)
An integrated multi-display tabletop centered urban design application
CELA 2017, ISS 2016
Read More | CELA Paper | ISS Paper | Video

Visualization and Interaction Design
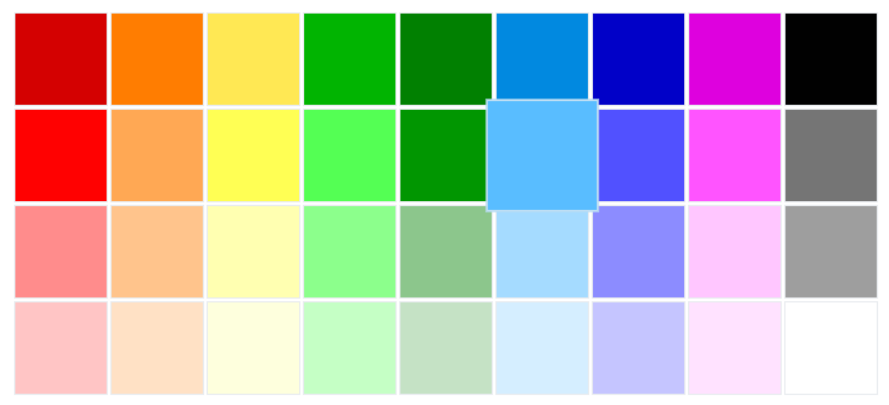
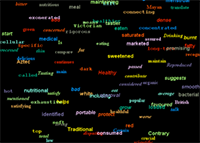
Color of Emotions
Investigating emotion-color association for visualizing emotions in online civic discussions
2018
Read More
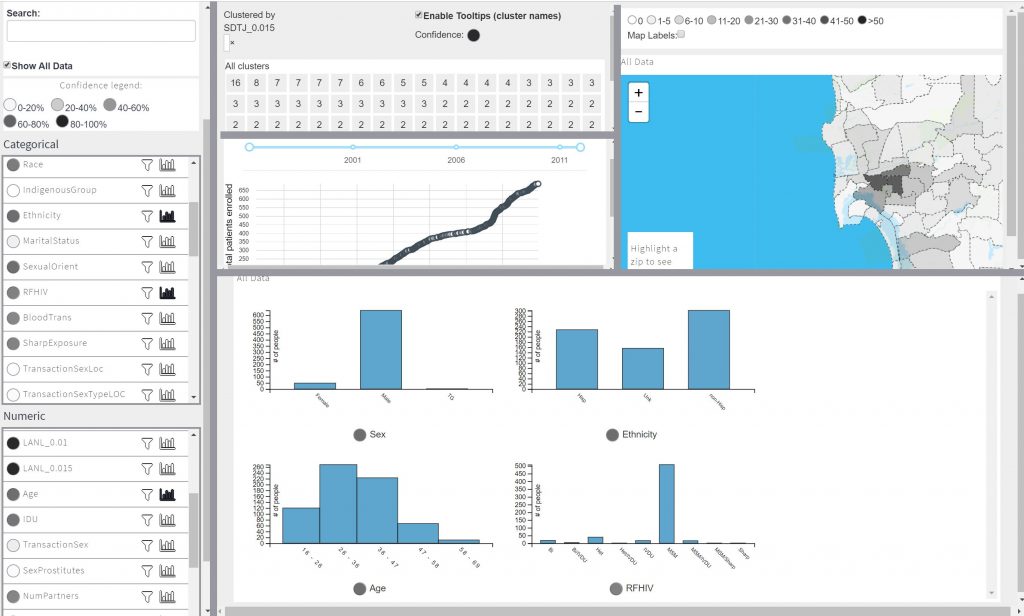
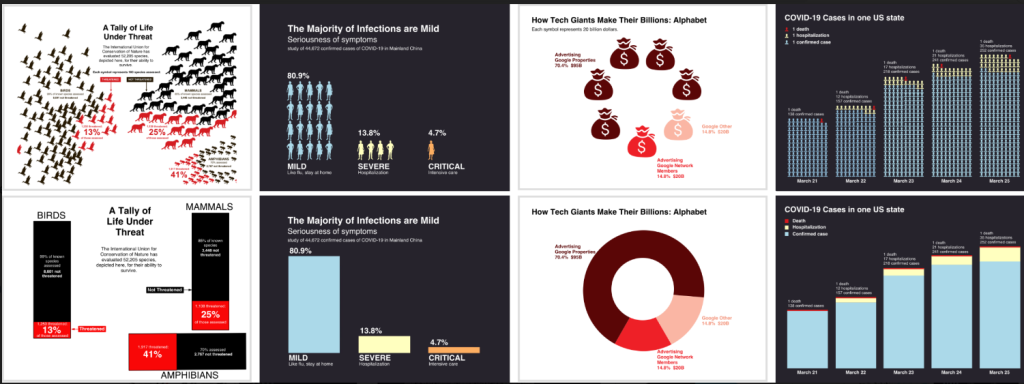
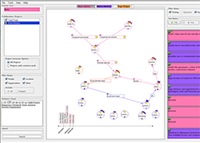
Avant-Garde
Online platform for multi-faceted visual analysis of HIV/AIDS data
Read More
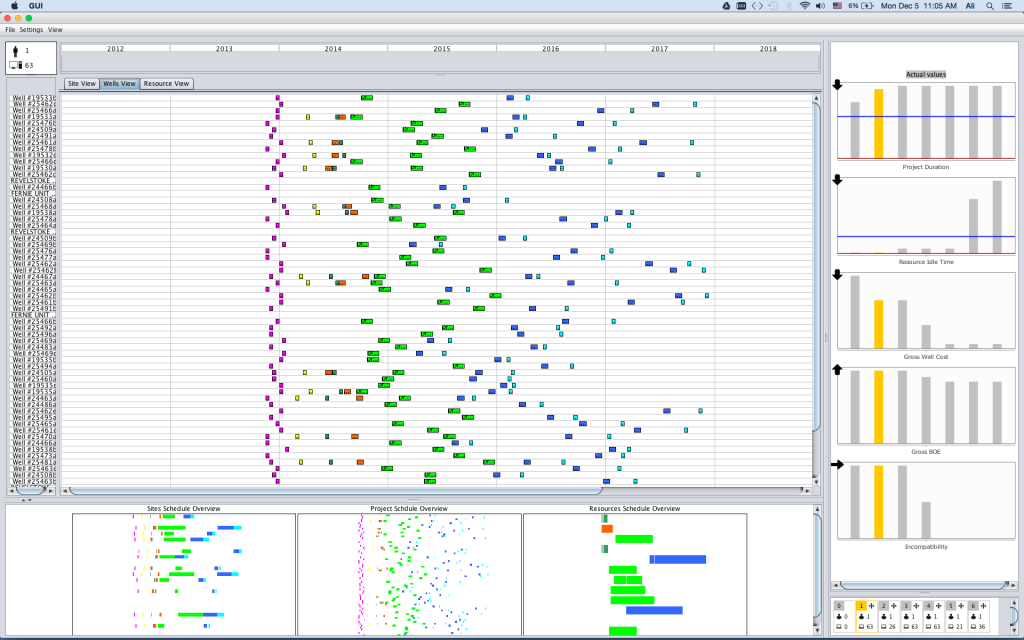
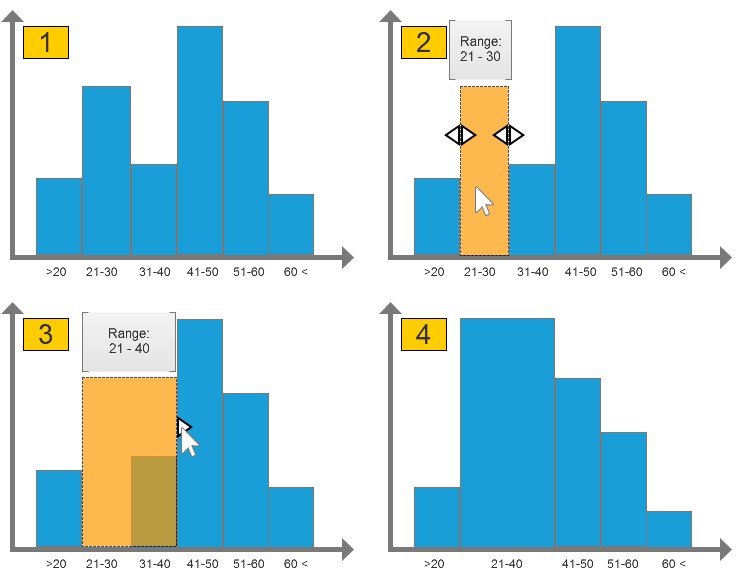
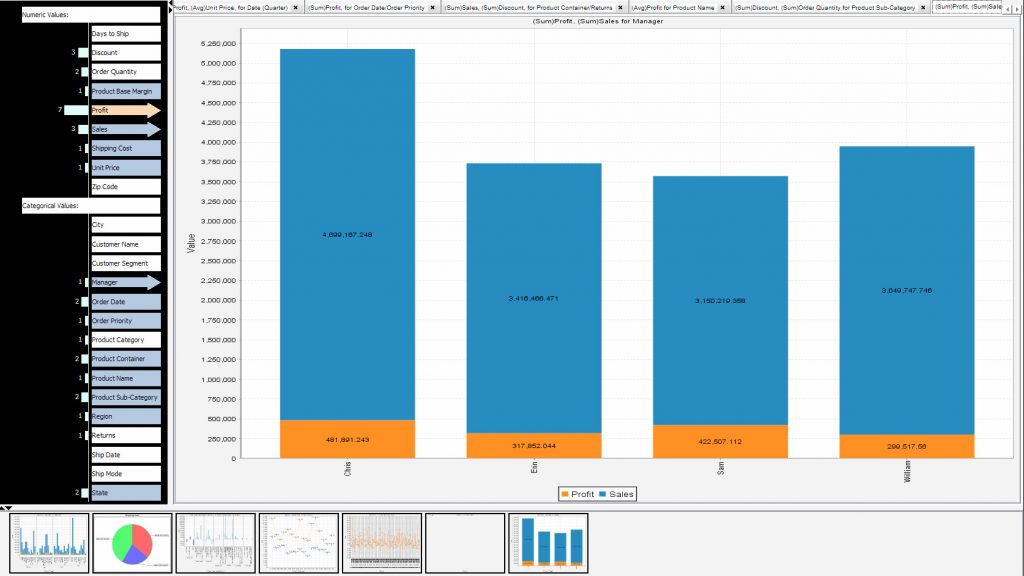
Actenum
Tool to assist oil and gas schedulers understand the identity and magnitude of schedule changes
Read More
Visual Analytics for Collaborative Sensemaking

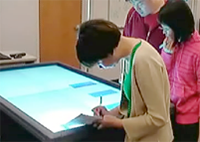
Collaborative Visual Data Analysis Around Large Interactive Surfaces
Co-located teams worked on collaborative visual analytics tasks using large interactive wall and tabletop displays
InfoVis 2011, VAST 2010
Read More | InfoVis Paper | VAST Paper