Color of Emotions

Color of Emotions

Led by: Mahmood Jasim

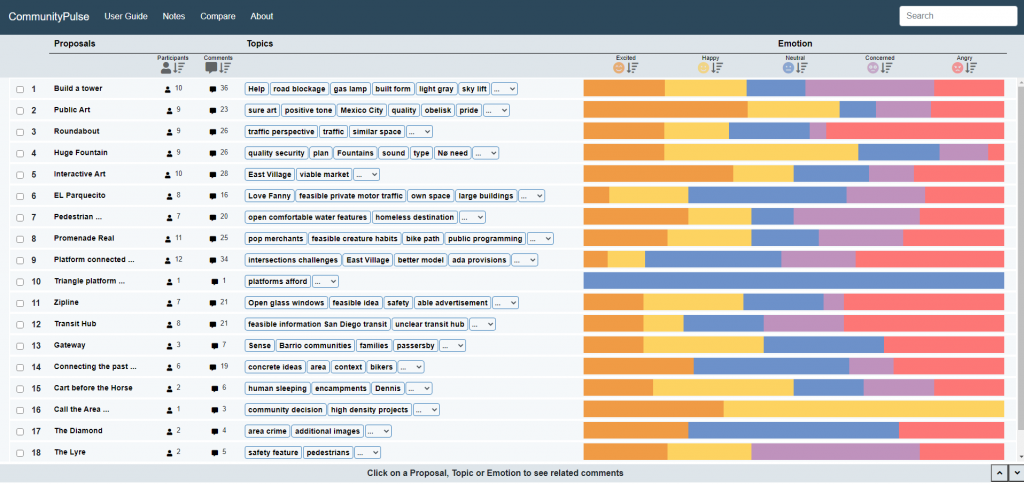
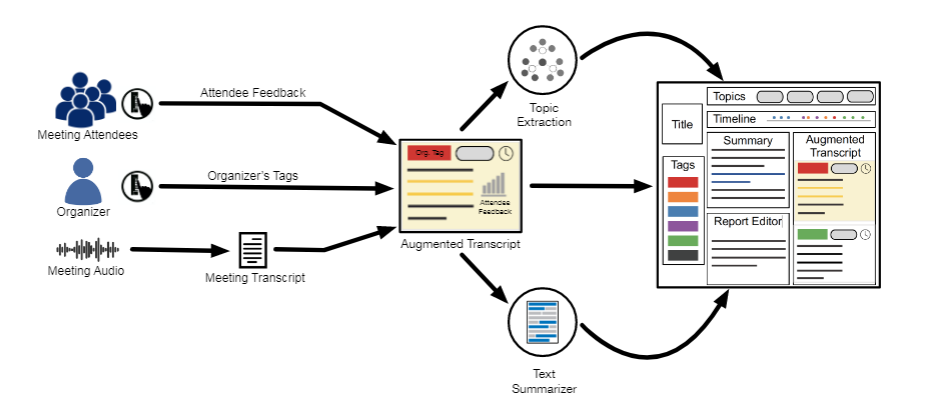
Online civic discussion platforms supplement face-to-face conversations while enabling a larger number of people to participate. To understand the public’s perspectives on civic issues, civic leaders are keen to learn people’s’ emotional stances. However, online platforms deprive the civic leaders of this vital insight due to the lack of appropriate mechanisms to convey non-verbal communications, including emotional responses. Moreover, discrete emotion categories are heavily dependent on the online discussion contexts and an agreed-upon set of emotions in the online civic discussion domain is still missing. The problem is exacerbated by the lack of consensus in ways to visualize emotions. In this work, our goal is to investigate and identify a set of emotions suitable for portraying emotional responses in online civic discussions, based on our interviews with civic leaders.

If you are interested in working on or learning more about this project, please contact Mahmood Jasim at mjasim@cs.umass.edu

CommunityPulse

CommunityPulse

A screenshot of the CommunityPulse layout. It has several rows of information representing a proposal, comment key words, and a stacked bar chart summarizing the emotions in comments associated with that proposal.

Led by: Mahmood Jasim
PDF CommunityPulse: Facilitating Community Input Analysis by Surfacing Hidden Insights, Reflections, and Priorities

Increased access to online engagement platforms has created a shift in civic practice, enabling civic leaders to broaden their outreach to collect a larger number of community input, such as comments and ideas. However, sensemaking of such input remains a challenge due to the unstructured nature of text comments and ambiguity of human language. Hence, community input is often left unanalyzed and unutilized in policymaking. To address this problem, we interviewed 14 civic leaders to understand their practices and requirements. We identified challenges around organizing the unstructured community input and surfacing community’s reflections beyond binary sentiments. Based on these insights, we built CommunityPulse, an interactive system that combines text analysis and visualization to scaffold different facets of community input. Our evaluation with another 15 experts suggests CommunityPulse’s efficacy in surfacing multiple facets such as reflections, priorities, and hidden insights while reducing the required time, effort, and expertise for community input analysis.

If you are interested in working on or learning more about this project, please contact Mahmood Jasim at mjasim@cs.umass.edu

CommunityClick

CommunityClick

Led by: Mahmood Jasim
CommunityClick: Capturing and Reporting Community Feedback from Town Halls to Improve Inclusivity
CommunityClick: Towards Improving Inclusivity in Town Halls

Local governments still depend on traditional town halls for community consultation, despite problems such as a lack of inclusive participation for attendees and difficulty for civic organizers to capture attendees’ feedback in reports. Building on a formative study with 66 town hall attendees and 20 organizers, we designed and developed CommunityClick, a communitysourcing system that captures attendees’ feedback in an inclusive manner and enables organizers to author more comprehensive reports. During the meeting, in addition to recording meeting audio to capture vocal attendees’ feedback, we modify iClickers to give voice to reticent attendees by allowing them to provide real-time feedback beyond a binary signal. This information then automatically feeds into a meeting transcript augmented with attendees’ feedback and organizers’ tags. The augmented transcript along with a feedback-weighted summary of the transcript generated from text analysis methods is incorporated into an interactive authoring tool for organizers to write reports. From a field experiment at a town hall meeting, we demonstrate how CommunityClick can improve inclusivity by providing multiple avenues for attendees to share opinions. Additionally, interviews with eight expert organizers demonstrate CommunityClick’s utility in creating more comprehensive and accurate reports to inform critical civic decision-making. We discuss the possibility of integrating CommunityClick with town hall meetings in the future as well as expanding to other domains. 

Our next step in this project is to virtualize the iClicker component to enable silent attendees to share their opinions during online meetings and discussions.

If you are interested in working on or learning more about this project, please contact Mahmood Jasim at mjasim@cs.umass.edu

Visualization of Differentially Private Data (VDPD)

Visualization of Differentially Private Data (VDPD)

Led by: Ali Sarvghad, Narges Mahyar
Current team: Mohammad Hadi Nezhad
Investigating Visual Analysis of Differentially Private Data

Differential privacy (DP) is an emerging technique for protecting sensitive data. This project investigates the principles of visual data exploration under differential privacy. In particular, we aim to understand if and how empirical visualization knowledge can be extended and adapted under DP.

If you are interested in working on or learning more about this project, please contact Ali Sarvghad at asarv@cs.umass.edu

Bloom’s Taxonomy for Evaluation

Bloom’s Taxonomy for Evaluation

Understanding a visualization is a multi-level process. A reader must extract and extrapolate from numeric facts, understand how those facts apply to both the context of the data and other potential contexts, and draw or evaluate conclusions from the data. A well-designed visualization should support each of these levels of understanding. We diagnose levels of understanding of visualized data by adapting Bloom’s taxonomy, a common framework from the education literature. We describe each level of the framework and provide examples for how it can be applied to evaluate the efficacy of data visualizations along six levels of knowledge acquisition – knowledge, comprehension, application, analysis, synthesis, and evaluation. We present three case studies showing that this framework expands on existing methods to comprehensively measure how a visualization design facilitates a viewer’s understanding of visualizations. Although Bloom’s original taxonomy suggests a strong hierarchical structure for some domains, we found few examples of dependent relationships between performance at different levels for our three case studies. If this level-independence holds across new tested visualizations, the taxonomy could serve to inspire more targeted evaluations of levels of understanding that are relevant to a communication goal.

If you are interested in working on or learning more about this project, please contact Alyx Burns at alyxanderbur at umass dot edu.

Creative-Pad

Creative-Pad

Led by: Narges Mahyar
On Two Desiderata for Creativity Support Tools

Creative-Pad is designed initially as a tool to help creative directors in an advertising agency to come up with new ideas to create an advertisement for their clients. These directors are often given a one-line brief describing a client product or service. For example, the sentence, “A car with more family space”, would describe a client’s new product which is a car targeted for family. The creative directors would have to design an advertisement suitable for promoting this product. They will need lots of ideas. Creative-Pad works by tapping into the internet as a rich source of information about all things. It takes in one or more keywords from the initial sentence and automatically searches the internet to retrieve any related information. It then processes the search results to extract interesting words and sentences. These words and sentences are then “beamed” in front of the creative directors to stimulate their thoughts for the new advertisement. An interface was specially designed to encourage creative thinking.

Actenum

Actenum

Led by: Ali Sarvghad

In oil and gas industry, upstream operations have large complex schedules. Creating and maintain these large schedules requires expertise and tool support. The interconnected nature of many activities makes changing/updating/optimizing schedules a sensitive task. For instance, a small change in a single activity duration can large impacts on schedule duration and operational costs. In this project, we designed a visual solution to assist schedulers in understanding the identity (what changed) and magnitude (the effect size) on a schedule from different angles.

Footprint & Footprint-II

Footprint & Footprint II

Led by: Ali Sarvghad
Visualizing Dimension Coverage to Support Exploratory Analysis

Footprint-II, a visual analysis history tool, was built to support coordination between analysts who worked in a different time/different place setting. The tool visualized the history of prior data explorations from three distinct angles: coverage of dimensions (e.g. Sales, Profit, Inventory Cost), coverage of data values, and the branching structure of the analysis. Our evaluation of this technique showed significant improvement in analysis coordination. Users of the tool better identified prior coverage by other and showed a greater focus on uninvestigated aspects of data.

Avant-Garde

Avant-Garde

Led by: Ali Sarvghad

Avant-Garde is an online platform for multi-faceted visual analysis of HIV/AIDS data. This tool enables clinicians to explore heterogeneous HIV/AIDS data to understand the phylogenetic, demographic, geographic and temporal characteristics and relationships in data. Various coordinated views represent data from different angles. Brushing-and-linking and dynamic filtering enable users to quickly discover the hidden relationships in data. This research a collaboration between faculties of Computer Science and Engineering (CSE) and Medicine at the University of California, San Diego.

Embedded Merge & Split

Embedded Merge & Split

Led by: Ali Sarvghad
Embedded Merge & Split: Visual Adjustment Of Data Grouping

This project investigates the use of novel and intuitive interaction techniques to support adaptive binning and grouping of data at the GUI level. Currently, exploratory data analysis tools only support the indirect manipulation of binning and grouping through interaction with various menus and sub-menus. We are investigating embedded interactions that enable a user to directly manipulate these criteria through interaction with graphical elements of a visualization.