Projects

Applied work in Digital Civics & Health
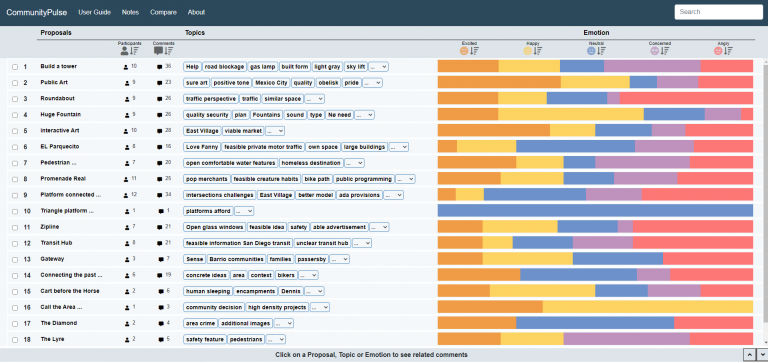
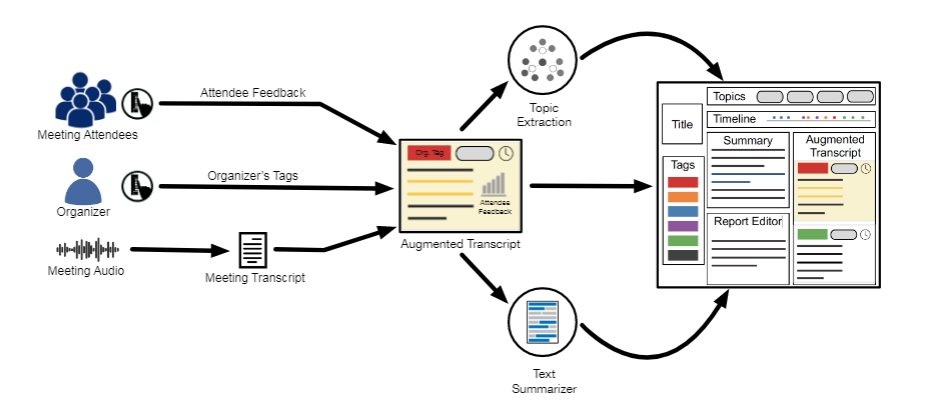
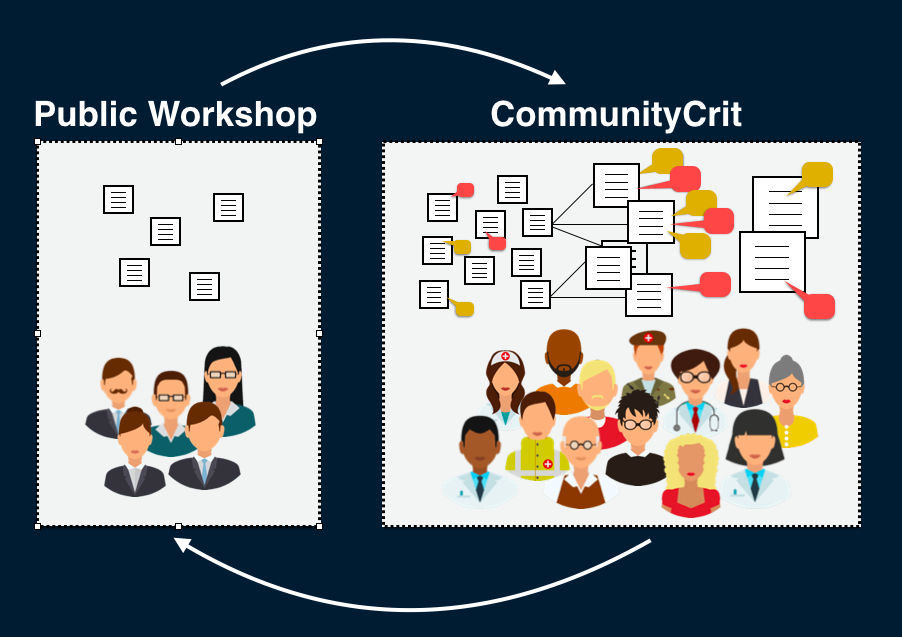
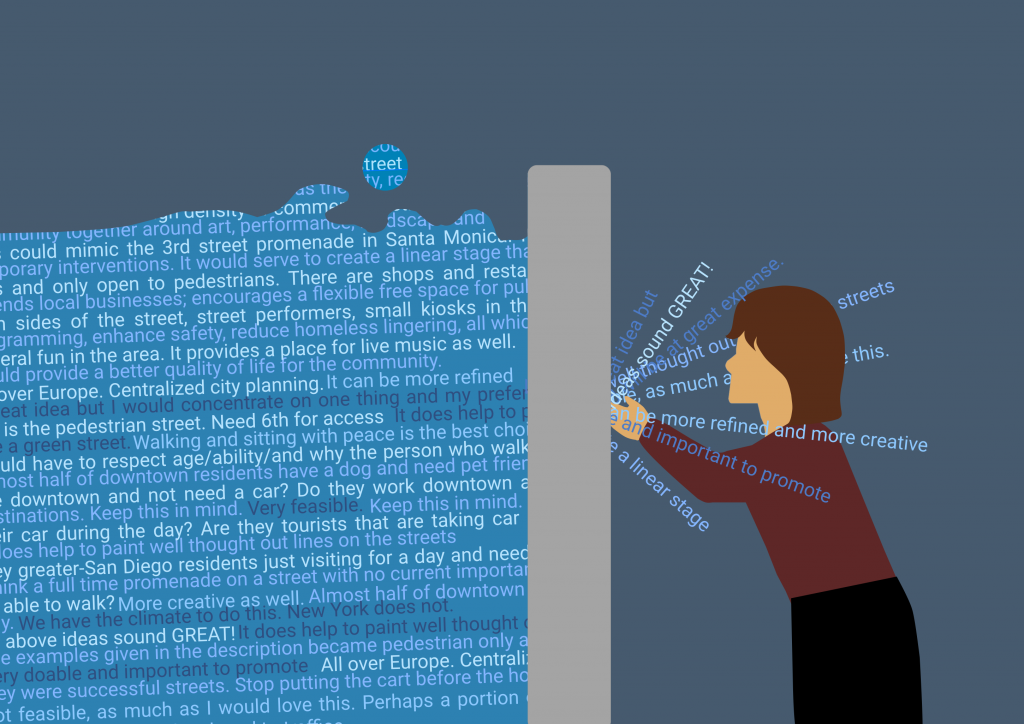

CommunityBots
Creating and Evaluating A Multi-Agent Chatbot Platform for Public Input Elicitation
CSCW 2023
Read More | Preprint

Mapping Instability
The Effects of the Pandemic on the Civic Life of a Small Town
AMPS Health and Design Network 2022
Read More | Full Paper

Framework for Open Civic Design
Integrating public participation, crowdsourcing, and design thinking
ACM Digital Gov 2021
Read More | Full Paper

CommunityPulse
Combining text analysis and visualization to scaffold different facets of community input
DIS 2021
Read More | Full Paper | Talk

CommunityClick
Capturing and reporting community feedback from town halls to improve inclusivity
CSCW 2020
Read More | Full Paper | Demo Paper | Talk

CommunityCrit
An online platform to help community members make meaningful contributions without significant time commitment
CHI 2018
Read More | Paper | Website | Talk

Rising Emotions
Visualizing the public’s emotions about flooding due to sea level rise
C&C 2021, Nominated for CODAawards 2020
Read More | Paper | Website | Video

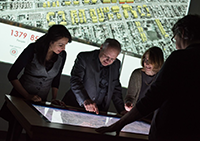
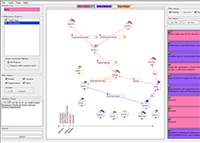
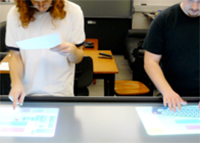
UD Co-Spaces (Urban Design Collaborative Spaces)
An integrated multi-display tabletop centered urban design application
CELA 2017, ISS 2016
Read More | CELA Paper | ISS Paper | Video

Civic Data Deluge
Understanding the Challenges of Analyzing Large-Scale Community Input
DIS 2019
Read More | Paper

Design for San Diego (D4SD)
An online platform to engage the public in solving San Diego’s mobility challenges
2010
Read More | Website | Video

ConsensUs
Visualizing points of disagreement
CSCW 2017
Read More | Paper

Citizen Sourcing
Supporting large-scale civic engagement
CSCW 2017
Read More | Paper

Rehabilitation Games in Real-World Clinical Settings
Understanding practices, challenges, and opportunities
TOCHI 2020
Read More | Paper

COVID-19 Pandemic’s Impact on Academic Community
Understanding the impact of the pandemic on the UMass Amherst community
ACM Digital Gov 2021
Read More | Paper

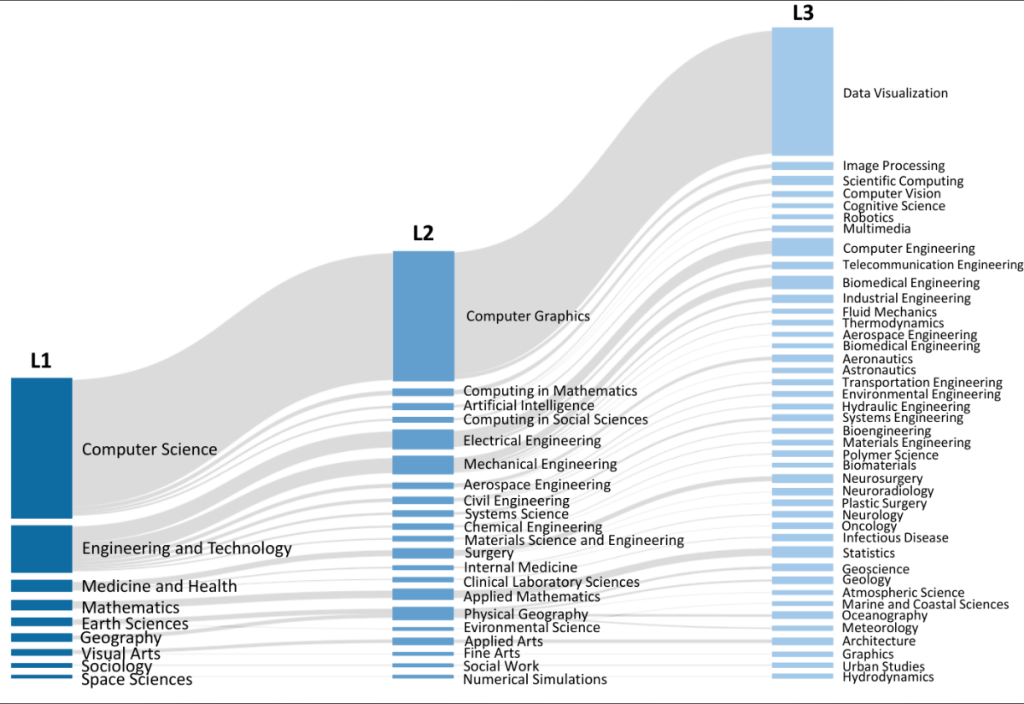
Communicative Visualizations & Visual Data Analysis
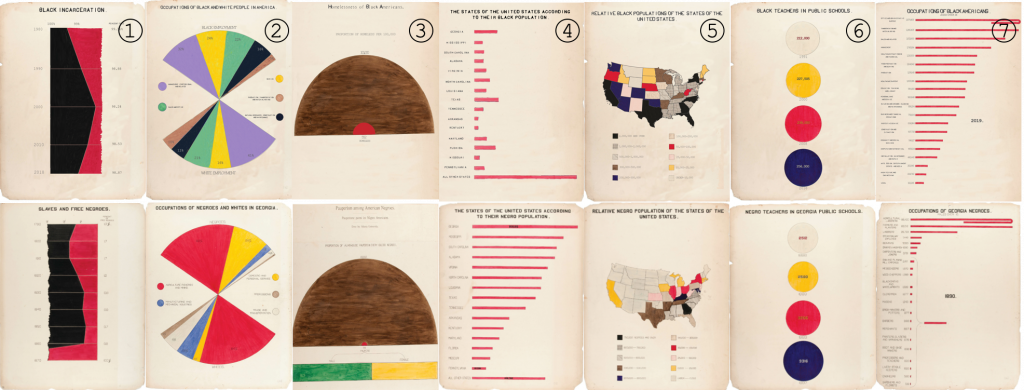
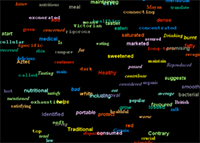

Communal Extended Reality (CXR)
Building Community Resiliency through Immersive CXR
MDPI Multimodal Technologies and Interaction 2023
Read More | Paper | Video

Practices of Data Scientists
Exploring how Data Scientists Review Scholarly Literature
CHIIR 2023
Read More | Preprint | Slides

From Invisible to Visible
Impacts of Metadata in Communicative Data Visualization
TVCG 2022
Read More | Preprint

Scientometric Analysis
Characteristics and trends of gender and collaboration among authors of IEEE VIS publications from 1990-2020
TVCG 2022
Read More | Dataset

Making the Invisible Visible
Risks and benefits of disclosing metadata in visualization
Vis4Good 2021
Read More | Paper | Talk

A set of 8 infographics in two rows. Each row of charts appear identical in layout, text, and color, except the top row uses small symbols in place of the more traditional blocky shapes of the lower charts.

Designing with Pictographs
How do infographics with pictograph arrays influence understanding?
TVCG 2021
Read More | Paper

Bloom’s Taxonomy for Evaluating Data Visualizations
Evaluating visualizations by measuring what kind of knowledge has been obtained
BELIV 2020
Read More | Paper | Talk

Revisiting W.E.B. Du Bois’ Abolitionist Visualizations
Recreating abolitionist visualizations with modern data
VIS Poster 2020
Read More | Paper | Talk

Color of Emotions
Investigating emotion-color association for visualizing emotions in online civic discussions
2018
Read More

Visualizing Dimension Coverage
Supporting exploratory analysis by visualizing what dimensions have already been explored
VAST 2016
Read More | Paper | Video

CLIP (Collaborative Intelligent Pad)
A prototype tool for collaborative sensemaking
VAST 2014
Read More | Paper | Video | Talk

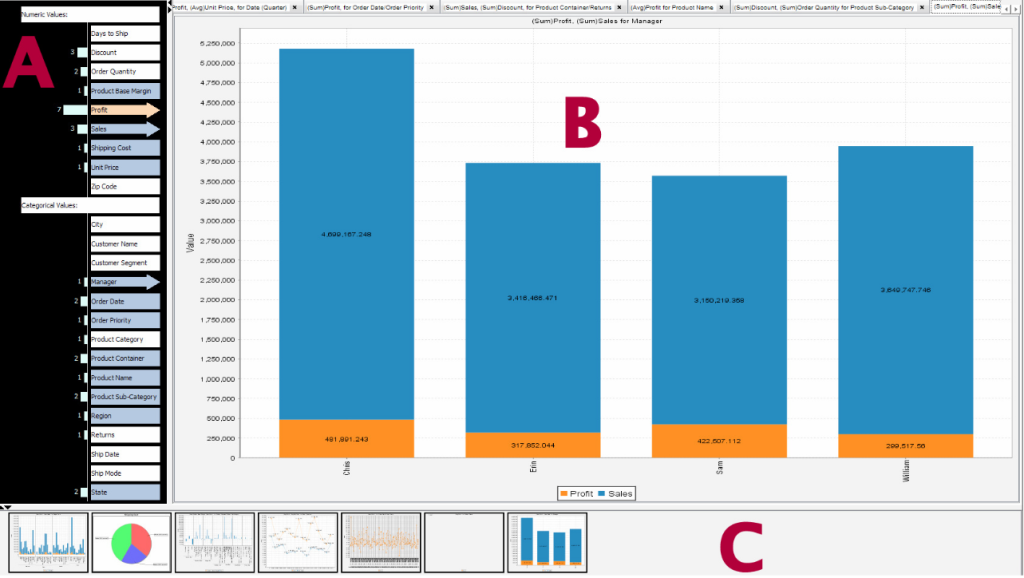
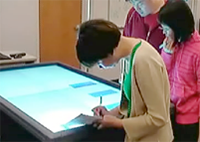
CoSpaces (Collaborative Workspaces)
Prototype for collaborative data analysis on a large interactive tabletop display
HICSS 2013
Read More | HICSS Paper | Video

Collaborative Visual Data Analysis Around Large Interactive Surfaces
Co-located teams worked on collaborative visual analytics tasks using large interactive wall and tabletop displays
InfoVis 2011, VAST 2010
Read More | InfoVis Paper | VAST Paper

Creative-Pad
Tool to help creative directors come up with new ideas for advertisements
ICCC 2010
Read More | Paper