Avant-Garde

Avant-Garde

Led by: Ali Sarvghad

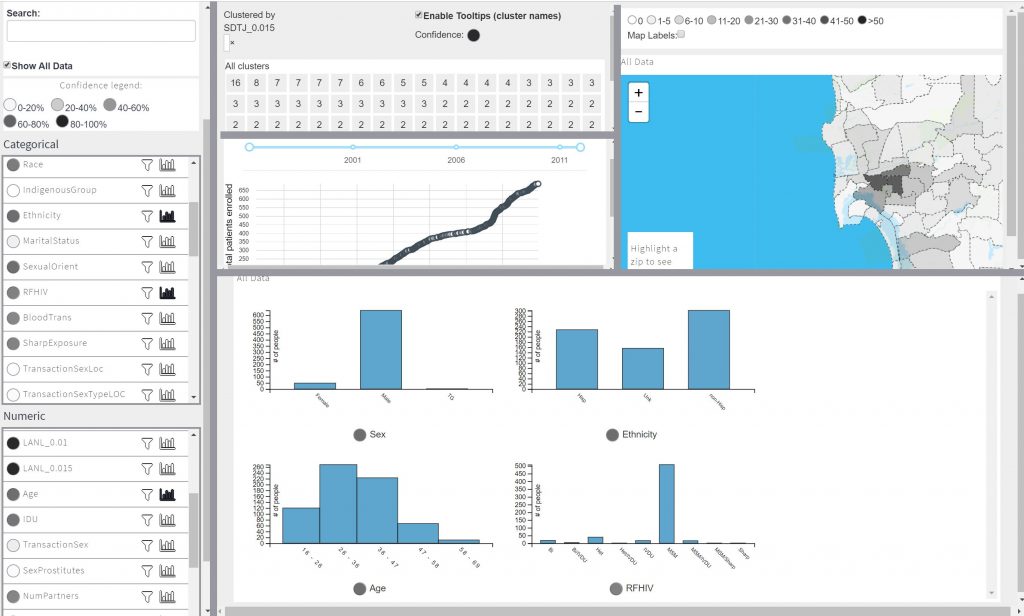
Avant-Garde is an online platform for multi-faceted visual analysis of HIV/AIDS data. This tool enables clinicians to explore heterogeneous HIV/AIDS data to understand the phylogenetic, demographic, geographic and temporal characteristics and relationships in data. Various coordinated views represent data from different angles. Brushing-and-linking and dynamic filtering enable users to quickly discover the hidden relationships in data. This research a collaboration between faculties of Computer Science and Engineering (CSE) and Medicine at the University of California, San Diego.

Embedded Merge & Split

Embedded Merge & Split

Led by: Ali Sarvghad
Embedded Merge & Split: Visual Adjustment Of Data Grouping

This project investigates the use of novel and intuitive interaction techniques to support adaptive binning and grouping of data at the GUI level. Currently, exploratory data analysis tools only support the indirect manipulation of binning and grouping through interaction with various menus and sub-menus. We are investigating embedded interactions that enable a user to directly manipulate these criteria through interaction with graphical elements of a visualization.

Revisiting Du Bois

Revisiting Du Bois’ Abolitionist Visualizations

2 rows of 7 visualizations are shown: The top row is made from new data, and the bottom row was made in 1900 by W.E.B. Du Bois

Led by: Andrew Cunningham, Alyx Burns, and Narges Mahyar
Looking to the Past to Visualize the Present: Revisiting W.E.B. Du Bois’ Abolitionist Visualizations
Talk

Amidst growing civil unrest in the United States, we are seeing a new wave of abolitionist thought, which challenges us to look at systems of historic oppression and imagine how we can fundamentally restructure them to bring about an equitable justice. In this poster, we revisit visualizations made in 1900 by sociologist and civil rights activist, W.E.B. Du Bois to help us view the modern state of race in America through a historical abolitionist lens. The juxtaposition of stylistically similar charts made over 100 years apart reveals that while America has made progress toward racial justice in some areas, there is still work to be done. We call upon the visualization community to highlight the experiences of marginalized people and to take part in visualizing data related to the pervasiveness of racism.

If you are interested in working on or learning more about this project, please contact Alyx Burns at alyxanderbur at umass dot edu.