
PAST PROJECTS
Project Descriptions:
Natural Language Processing
Natural language processing (NLP) utilizes Artificial Intelligence to analyze and understand language to be interpreted and spoken by computers.
This project will seek to automatically extract cases of derived or updated datasets and usages of datasets by using extractions from papers which cite a dataset paper in the areas of machine learning and NLP. These extractions will serve as one piece of documentation for datasets and potentially serve as initial information with which to populate a Wiki for datasets.
Recent work has presented critical perspectives on the ways in which dataset annotation, documentation, and distribution in machine learning operates in an ad-hoc manner [Paullada et al., Seo Jo and Gebru, Narayanan et al]. We will attempt to present a solution to the general problem of dataset documentation and distribution. Specifically, because of the lack of central dataset governance structures in machine learning, datasets flagged for removal, or datasets superseded by other datasets continue to be used. In this work we will focus on automatically creating summaries of the evolution and usage of ML/NLP datasets using a corpus of scientific papers and their citation network information — first attempts at a summary will simply work by filtering sentences which contain citations. A stretch goal may be that of using the extractions to automatically populate an initial “Dataset Wiki”, where wikis provide a community centered way to document datasets created jointly with users and automatic methods.
This project broadly seeks to study the meaning of words and their usage by specific communities of speakers, which falls under the topic of lexical semantics and sociolinguistics respectively. We will explore methods to identify words which have a different sense in academic documents for a specific academic community vs a different academic community and vs more colloquial English documents.
We will use word2vec vector representations of a word to study the different meanings they have across different collections of documents. The datasets we will be working with are scientific papers (with metadata indicating their publication venues and broad area) in the Semantic Scholar Open Research Corpus (S2ORC) and colloquial English represented in New York Times articles.
Storytelling has long been used as a teaching device and a way of passing down cultural knowledge. Works of creative fiction provide many readers with entertainment, reflect on the human condition, allow for escapist fantasies, and more. Static works of fiction do not provide the reader any agency in deciding the direction of the story as it unfolds. Both choose your own adventure books and interactive fiction provide some forms of agency, but rely on authors to support a small set of alternate realities which may not conform to a readers interests. This is where personalized storytelling in the form of computer generated narratives could help.
The research on the Storium platform makes use of a large pre-trained language model named GPT-2. Previous work by See et al. 2019 (Do Massively Pretrained Language Models Make Better Storytellers?) analyzed the outputs of models like GPT-2 in the context of storytelling, using a dataset of short stories. The authors of this research released the code used to analyze the generated stories. In this project we would first try to replicate the analysis using the data from Storium, then move on to analyze the edits users made to our models’ suggestions.
The media we as a society consume, often reflects the norms and biases of our culture. Recently, fairness and bias research in NLP has analyzed news, job applications, and other non-creative texts, yet relatively little attention has been paid to biases present in literature. While social scientists and literary scholars do study these topics, it is difficult to scale such analyses without the help of computational methods. Thus, this research will look to use NLP to analyze a corpus of literary text for various forms of gender bias. Doing such analysis at scale gives a broad sense of the prevalence of such bias in literature at large.
Works of fiction tend to make more use of metaphor, foreshadowing, and other literary devices which are not well represented in typical online interactions over social media. This research will look to validate the approach from Unsupervised Discovery of Implicit Gender Bias to the literary domain of fan fiction.
Data Analysis
Data Analysis encompasses a wide range of technologies. These projects have a focus on interpreting or processing data to be better utilized for their initial purpose.
The proposed research is in the field of causal inference, which is central to many fields like medicine, social sciences, and economics. Causal inference aims to capture causal relationships in the data. These relationships are often represented as a causal graph. In causal inference, there are broadly two goals, causal discovery task and causal effect estimation.
We will perform experiments to understand the relationship between informativeness of the prior and dataset sample size. From the survey of the previous works, one consistent finding was that if prior beliefs are closer to the true model, then they improve the learning process but if priors are misleading or incorrect, they harm the learning process [1]. We want to further understand this phenomenon by doing various experiments which systematically vary dataset size and prior correctness. We will also focus on understanding the relationship between how complicated the prior is (expressiveness of prior e.g. edge orientation vs path) and learning accuracy.
Since humans tend to follow specific social behavioral patterns, learning their social behaviors in an unobtrusive and automated manner can assist many domains. For example, group mobility behaviors affect crowd dynamics. This is important for improving network congestion avoidance and demand management. Understanding group mobility dynamics can also assist recommendation systems by understanding user profiles. Furthermore, identifying group mobility behavior from sensor data will help build on existing social theories at a large-scale, which is otherwise unfeasible.
While the overarching goal is to build a robust group detection model using spatially coarse-grained mobility records, a significant portion of the work goes into discovering features that can potentially be key predictors of our model. This requires us to conduct longitudinal behavioral analysis of students’ mobility behavior over the course of the semester, identifying routine behaviors and changes in behavior at significant time points (e.g., exam week, break week). In this work, we are interested in identifying key predictors of group behavior.
Differential privacy is a mathematical framework that guarantees data privacy in the analysis of sensitive datasets (e.g., healthcare data). Differential privacy has emerged in recent years as a broadly useful set of methods for privacy-preserving machine learning. It has been adopted by both large corporations and the government (for example, for the analysis of the US Census 2020 data)
Public and private organizations have access to large amounts of data, and want to analyze it to learn trends and aggregate statistics. Doing so with sensitive data can be risky, as the result of an analytic process can reveal information about individuals represented in a dataset. Differential privacy seeks to solve this problem by guaranteeing that the contribution of a single individual to the released statistic cannot be distinguished/leaked. This allows companies and the government to safely release statistics from sensitive data.
This project ran experiments on simulated data to apply an estimation procedure (such as computing the mean) in non-private vs private scenarios. This is done to quantify performance average and bias/error for different scenarios. Through the utilization of the bootstrap algorithm, bias was removed from estimates.
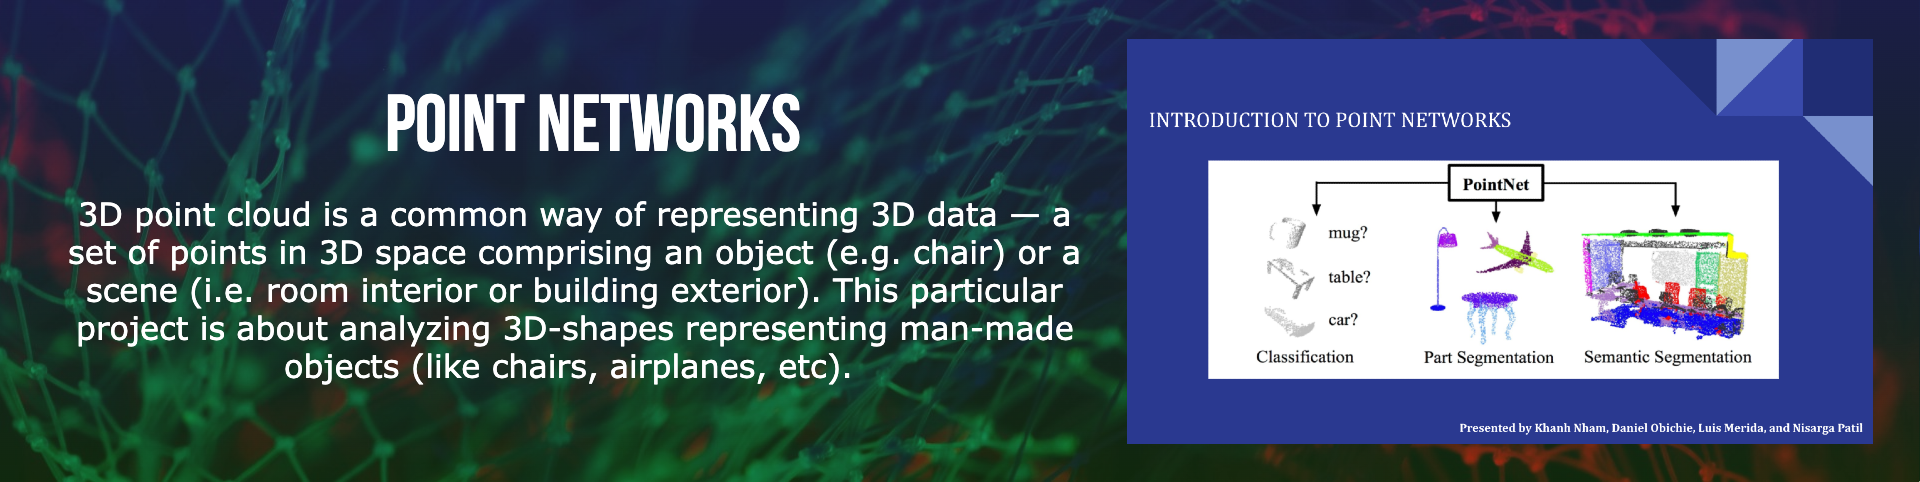
3D point cloud is a common way of representing 3D data — a set of points in 3D space comprising an object (e.g. chair) or a scene (i.e. room interior or building exterior). For some tasks it is a natural representation of the data involved. For example, in autonomous driving LiDAR sensors use laser impulses to measure distance to objects around and naturally produce point clouds. Point clouds also can be thought of as a somewhat simpler representation of 3D data compared to other approaches like ones that model 3D shape surfaces using polygons.
This particular project is about application of several well-know point networks to analysis 3D-shapes representing man-made objects (like chairs, airplanes, etc). One of such networks can be recent Point Transformer architecture (there is non-native implementation available) and evaluation of it on a ShapeNet dataset. Another network to try one can be Dynamic Graph CNN (original implementation). Students will learn how to make predictions of the model and visualize predictions using 3D visualization tools.
Human-Computer Interaction
Human Computer Interaction is a subdivision of research that focuses on the relationships between humans and computers. This includes optimizing the ways computers can be used through the analysis of human response to these technologies.
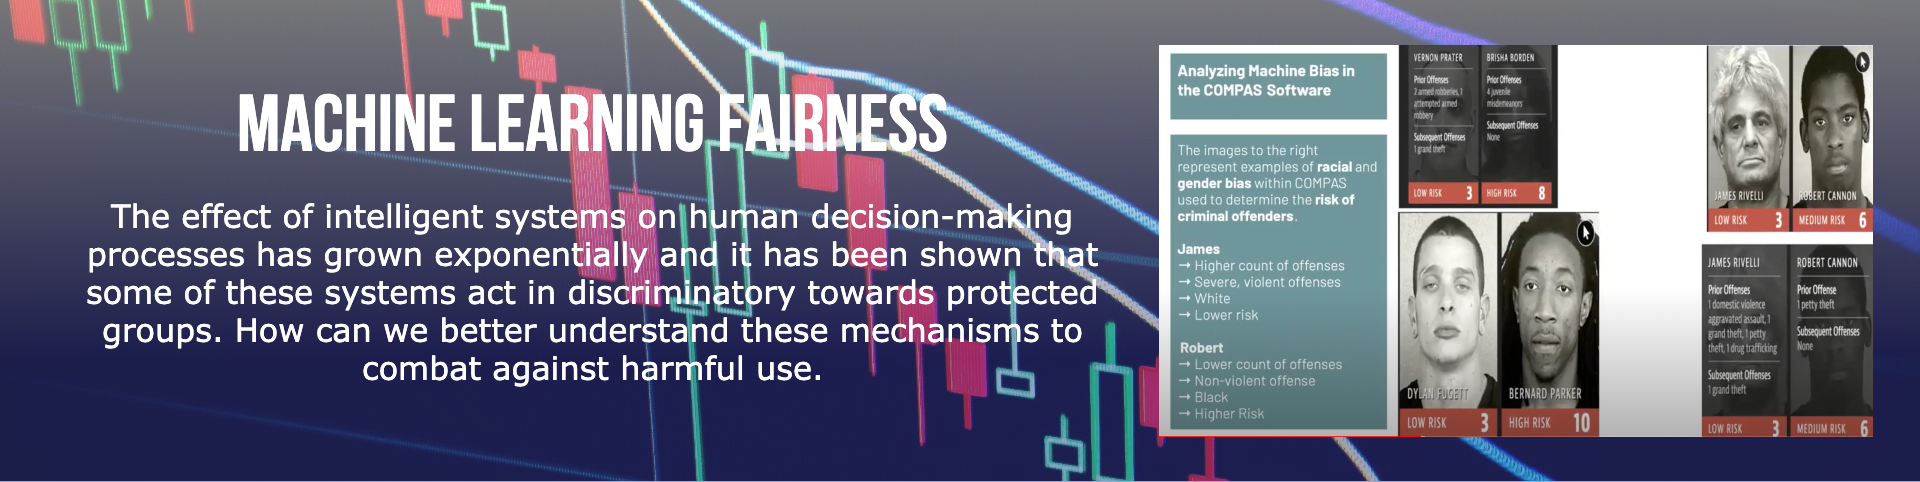
The proposed research project is in the area of machine learning fairness, i.e., how can we prevent intelligent systems that utilize machine learning techniques from acting towards people in harmful ways (e.g., acting racist or sexist). The effect of intelligent systems on human decision-making processes has grown exponentially and it has been shown that some of these systems act in discriminatory towards protected groups. Therefore, the work in this research area is imperative for alleviating the harm that can be and has been caused by intelligent systems.
Students will be using one of two provided fairness in machine learning libraries from Microsoft and IBM on a real-world dataset commonly used in fairness research such as the COMPAS or the German Credit dataset. Students will train a selected fairness model and test it using accuracy and some basic fairness metrics. Then, students will use the SHAP input influence library or re-implement it to measure the influence of certain features on the selected model’s predictions. If time permits, students can study more models or take a deeper dive into the details of their results.
The proposed research is in the context of mobility modeling and design. Understanding human mobility is a fundamental systems problem. A specific variant of mobility modeling is next location prediction. Next location prediction techniques capture the spatial and temporal correlations between human mobility patterns. With the popularity of smart mobile devices and location-based social networks, building accurate and robust mobility prediction models is relevant to ubiquitous computing.
With the availability of large scale data, machine learning (ML) is being used to do next location prediction. A common approach is to train a general ML model using aggregated training data from a larger number of users. Such a model encodes behavior of a large group of users and can predict the future behavior of a user who resembles one in the training set. While a general model can learn correlations in mobile behavior across users and perform well across a range of users that behave similarly, they are less effective for individual users who exhibit idiosyncratic or dissimilar behavior. To address this issue, researchers have proposed to train personalized models for users to capture their unique behavior. The advantage of model personalization is that it can yield more accurate user-specific predictions. In this work, our goal is to develop and evaluate supervised ML methods for personalized next location prediction.
A challenge in today’s K-12 educational system is the lack of focus and understanding of educators’ needs such that they could help their students. Specifically, K-12 educators are constantly juggling among policy changes, pressures from districts, and demands from students and their family. Hence, their teaching strategies and lesson plans might not also be guided by objective evidence. In other words, K-12 educators need and seek objective information to inform not only how their students are progressing but also how effective their lesson plans are.
The goals of this research are two-fold. First, we want to provide participants of this course with hands-on experience for conducting research including defining research questions, identifying hypotheses, and conducting evaluations. Second, we aim to expose students to the application of exploratory analysis by gaining insights into real world education science data. Through these two goals, students will also have the opportunities to propose effective interventional strategies applicable for educators.
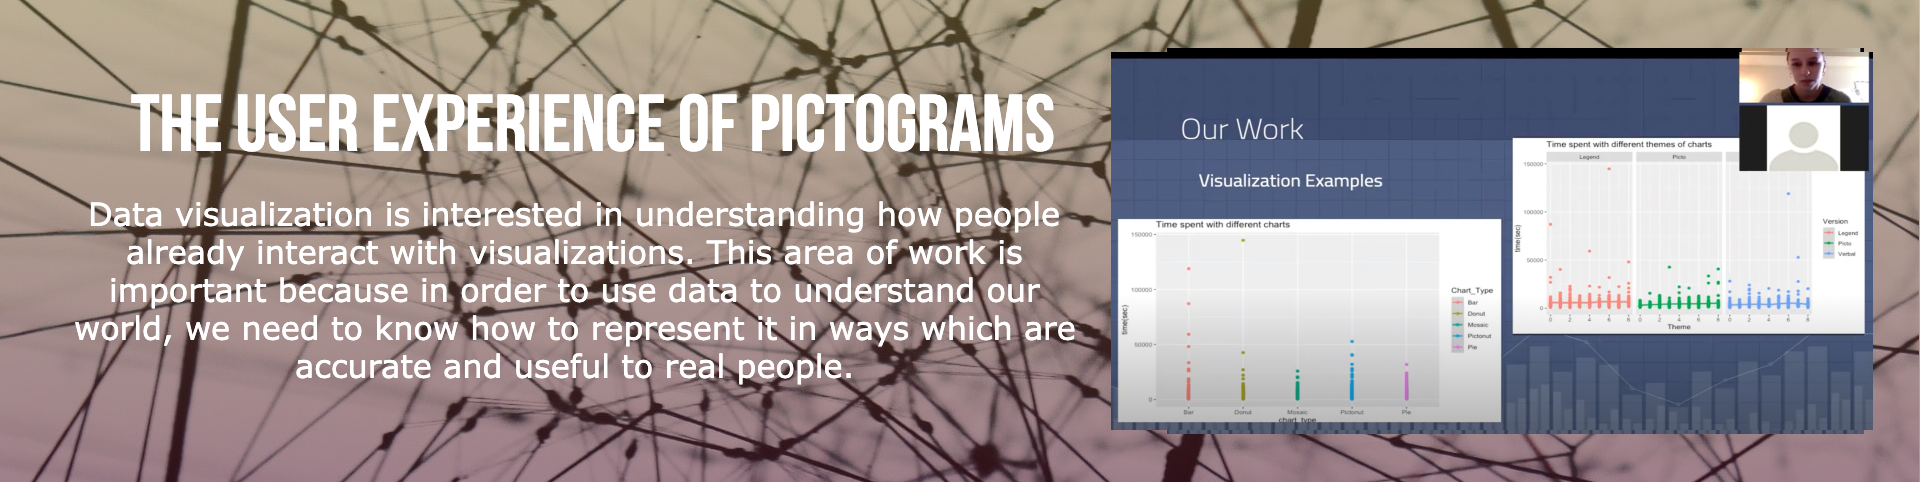
As a research area, data visualization is interested in understanding how people already interact with visualizations, how changes to visualizations affect interpretation, and how to create new, more effective types of visualization. This area of work is important because in order to use data to understand our world, we need to know how to represent it in ways which are accurate and useful to real people.
Data visualizations are hypothesized to help people reason and talk about data in a way they cannot with the numbers alone. The area of data visualization seeks to find new ways to represent data which are accurate and useful. It also tries to understand how people already use visualizations to inform best practices and new designs.
Both of the proposed projects will help us better understand the ways that pictographs impact user experience. These projects are part of a larger effort to investigate how to make fairly standard data visualizations more enjoyable and useful for general audiences. This is of particular interest because tools that are enjoyable are also thought to work better and may lead to improved outcomes, so we’d like to know how changing the presentation of charts impacts how well they actually serve their purpose.