Research Projects
Exploratory Visual Analytics & Provenance-Driven Systems
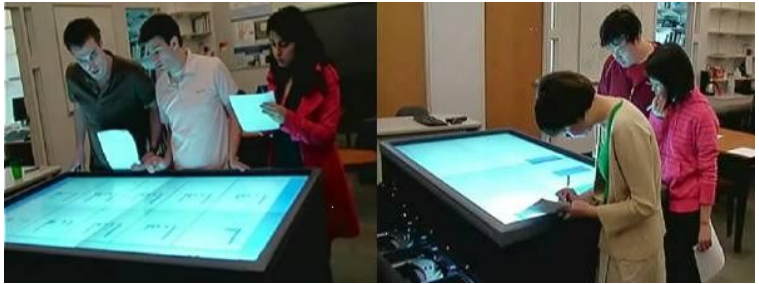
Identifying the Role of Record-keeping in Visual Analytics
A Closer Look at Note Taking in the Co-located Collaborative Visual Analytics Process
VAST 2010 | Paper
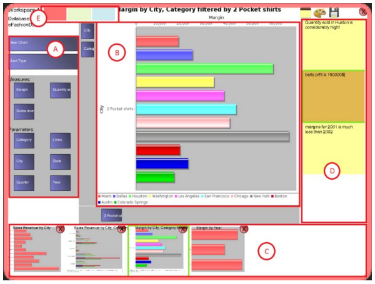
Augmenting Visual Analytics with Provenance
Observations of Record-Keeping in Co-located Collaborative Analysis
HICSS 2013 | Paper
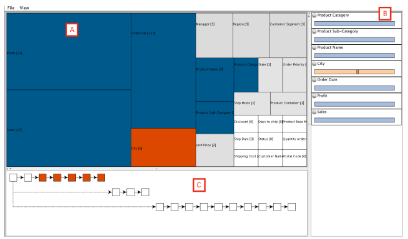
Facilitating Handoff in Collaborative Visual Analytics
Exploiting History to Reduce Interaction Costs in Collaborative Analysis
GI 2015 | Paper
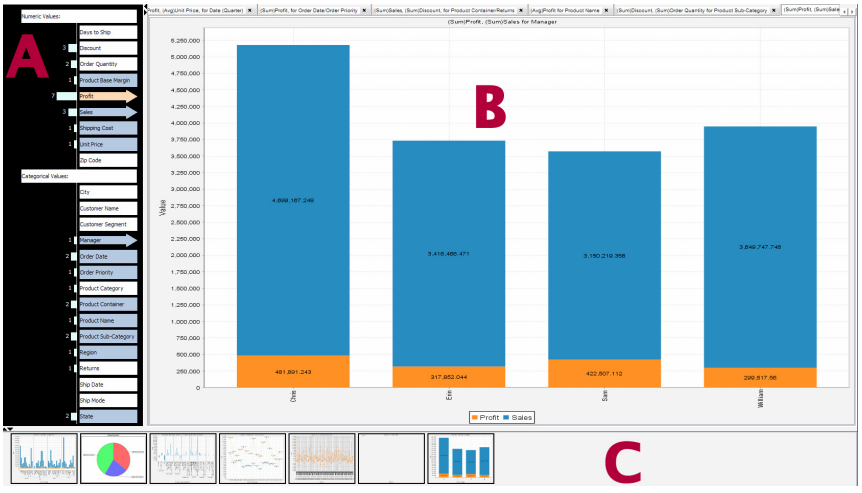
Increasing Depth and Breadth of Visual Data Exploration
Visualizing Dimension Coverage to Support Exploratory Analysis
TVCG 2016 | Paper
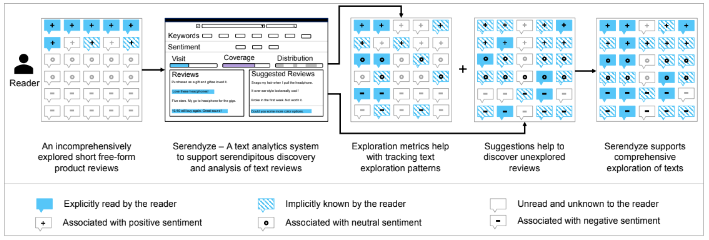
Supporting Supporting Serendipitous Discovery & Balanced Analysis
Supporting Serendipitous Discovery and Balanced Analysis of Unstructured Text with Interaction-Driven Metrics and Bias-Mitigating Suggestions
CHI 2022 | Paper
Privacy-Preserving Data Visualisation
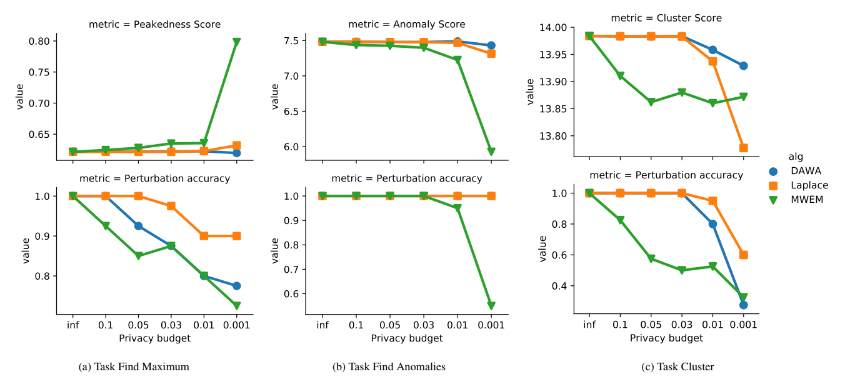
Balancing Privacy-Utility Tension in Differentially Private Scatterplots
Investigating the Visual Utility of Differentially Private Scatterplots
TVCG 2023 | Paper
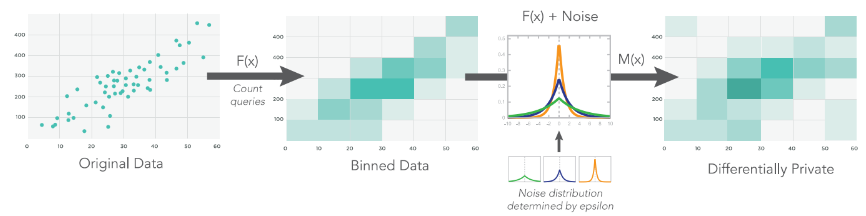
Investigating Visual Analytics under Differential Privacy
Investigating Visual Analysis of Differentially Private Data
TVCG 2020 | Paper
Graphical Perception & Interaction Design
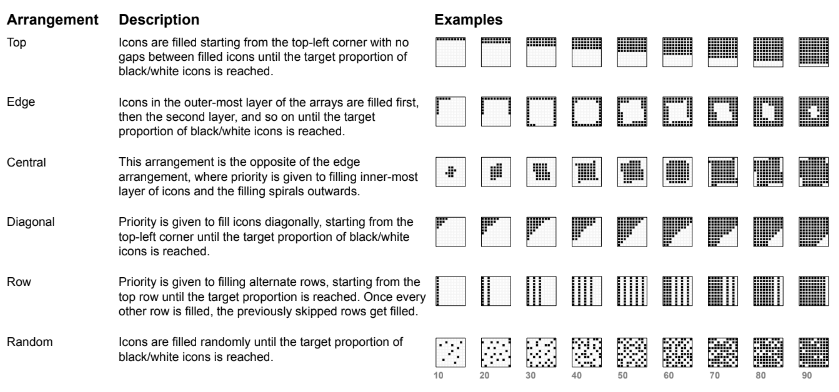
Investigating Perceptual Biases in Value Estimation Tasks
Investigating Perceptual Biases in Icon Arrays
CHI 2022 | Paper
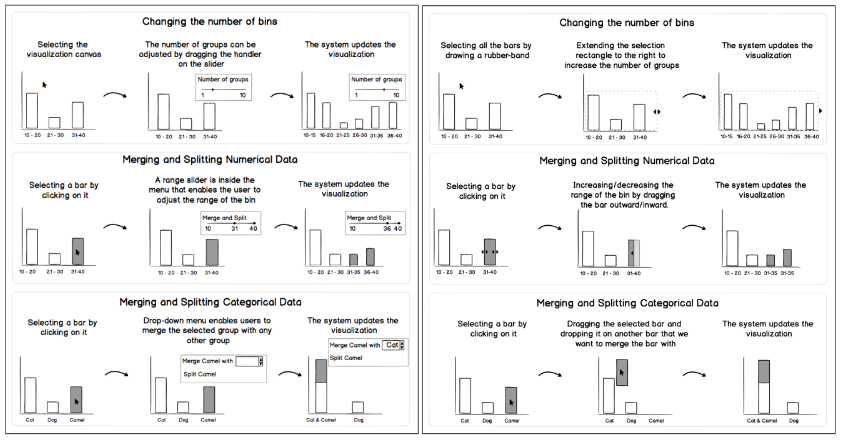
Direct Data Manipulation via Interaction with Visual Glyphs
Embedded Merge & Split: Visual Adjustment of Data Grouping
TVCG 2018 | Paper
Utilizing AI and Visual Analytics for Social Impact
Moving Beyond Sentiment Analysis in Textual Data
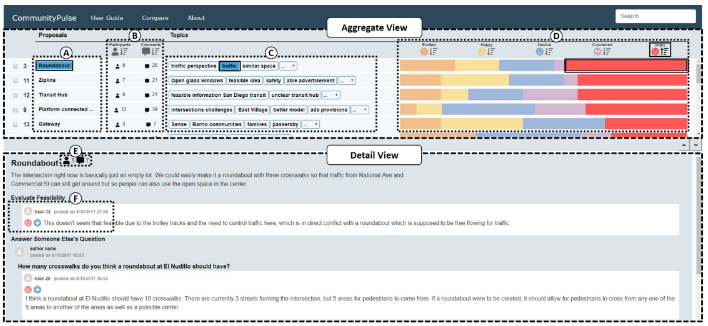
CommunityPulse: Facilitating Community Input Analysis by Surfacing Hidden Insights, Reflections, and Priorities
DIS 2021 | Paper
Improving Inclusivity in Public Input Gathering and Analysis
CommunityPulse: Facilitating Community Input Analysis by Surfacing Hidden Insights, Reflections, and Priorities
CSCW 2020 | Paper
Extending Inclusive Data Collection to Virtual Meetings
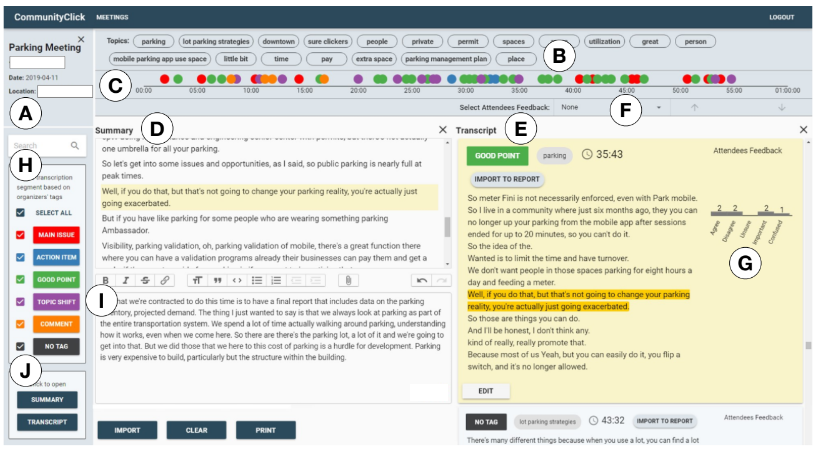
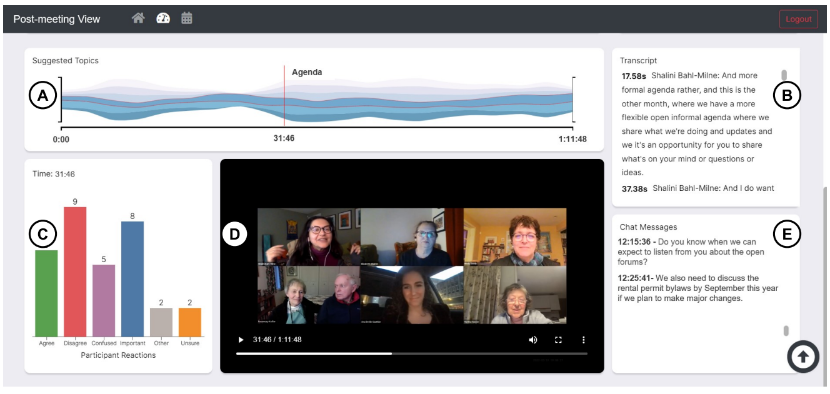
CommunityClick-Virtual: Multi-Modal Interactions for Enhancing Participation in Virtual Meetings
MERCADO VIS 2023 | Paper
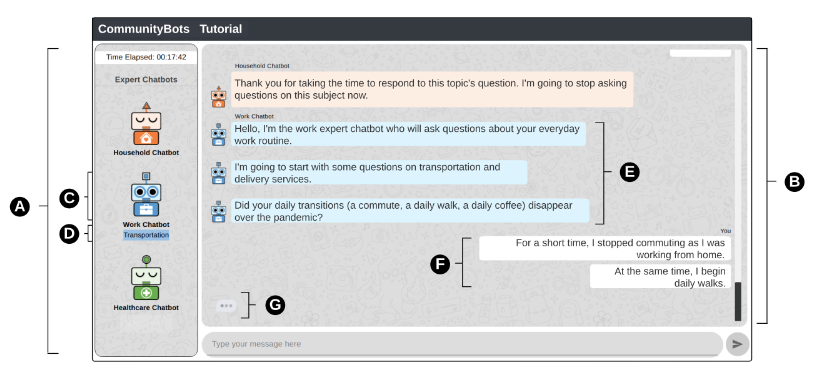
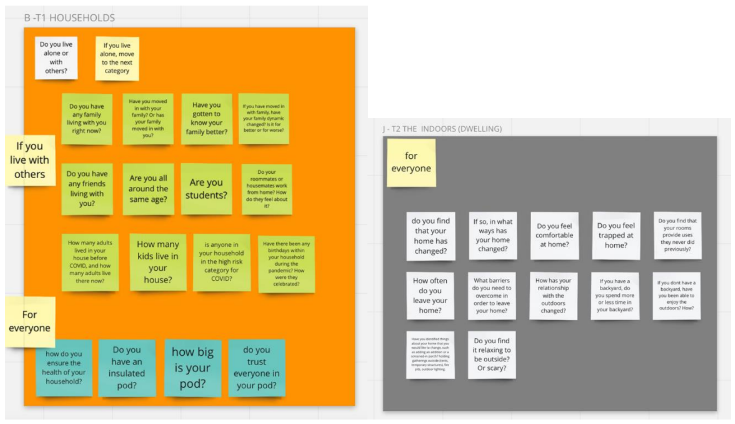
Multi-Agent AI-Driven Conversational Data Collection
CommunityBots: Building and Evaluating a Community of Chatbots for Gathering Public Input
CSCW 2023 | Paper
Inclusive & Equitable Visualization
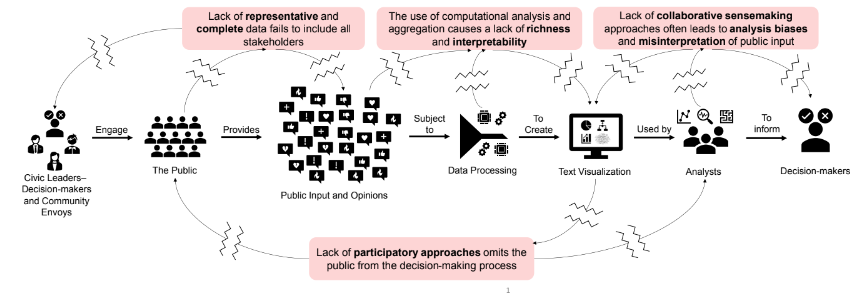
Investigating the Political Ramifications of Text Analysis
Of Course it’s Political! A Critical Inquiry into Underemphasized Dimensions in Civic Text Visualization
EuroVis 2022 | Paper
Exploring Pandemic Effects on Small-Town Civic Life
Mapping Instability: The Effects of the Pandemic on the Civic Life of a Small Town
Environments by Design AMPS 2022 | Paper
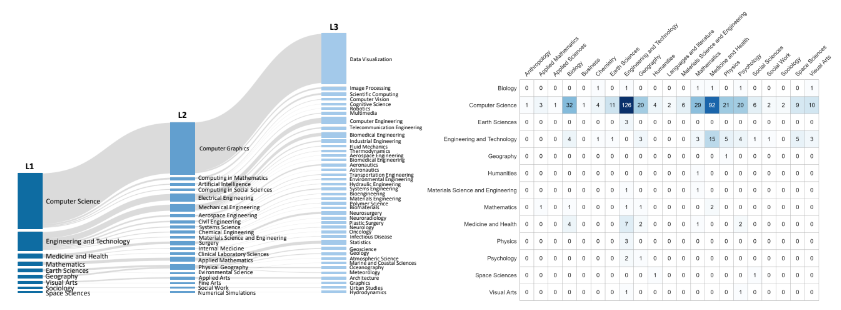
Disciplinary Diversity and Gender Equity in Visualization Research
Scientometric Analysis of Interdisciplinary Collaboration and Gender Trends in 30 Years of IEEE VIS Publications
TVCG 2022 | Paper