Eric P. S. Baumer, Mahmood Jasim, Ali Sarvghad, & Narges Mahyar’s paper “Of Course it’s Political! A Critical Inquiry into Underemphasized Dimensions in Civic Text Visualization.” was awarded best paper at EuroVis 2022. You can find the full paper here. Congratulations to all of the authors!
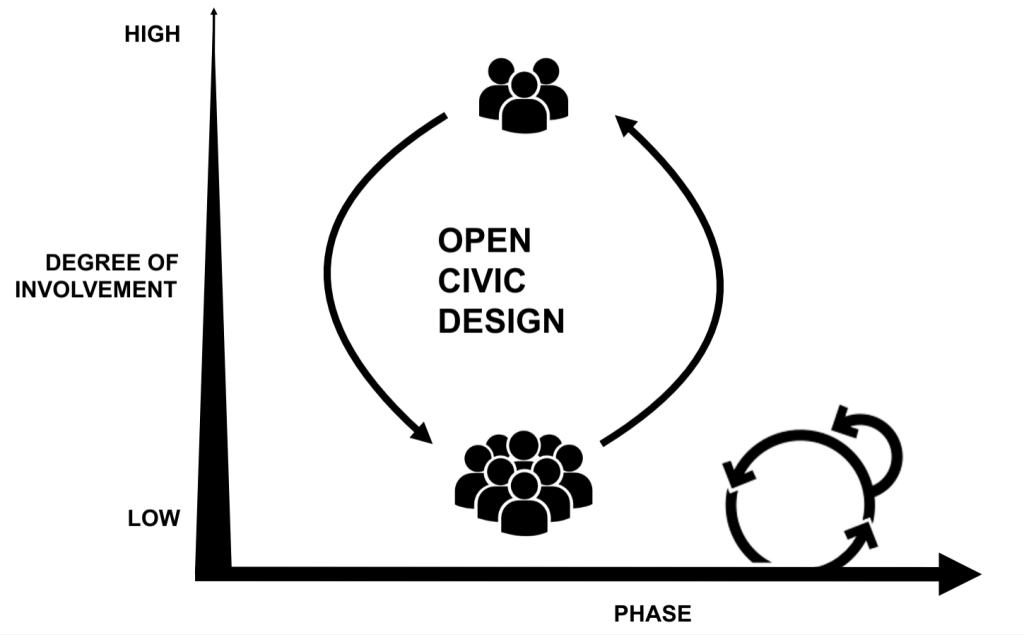
Framework for Open Civic Design
Framework for Open Civic Design
Led by: Brandon Reynante, Steven P. Dow, and Narges Mahyar
Related Papers: “A Framework for Open Civic Design: Integrating Public Participation, Crowdsourcing, and Design Thinking”
Civic problems are often too complex to solve through traditional top-down strategies. Various governments and civic initiatives have explored more community-driven strategies where citizens get involved with defining problems and innovating solutions. While certain people may feel more empowered, the public at large often does not have accessible, flexible, and meaningful ways to engage. Prior theoretical frameworks for public participation typically offer a one-size-fits-all model based on face-to-face engagement and fail to recognize the barriers faced by even the most engaged citizens. In this article, we explore a vision for open civic design where we integrate theoretical frameworks from public engagement, crowdsourcing, and design thinking to consider the role technology can play in lowering barriers to large-scale participation, scaffolding problem-solving activities, and providing flexible options that cater to individuals’ skills, availability, and interests. We describe our novel theoretical framework and analyze the key goals associated with this vision: (1) to promote inclusive and sustained participation in civics; (2) to facilitate effective management of large-scale participation; and (3) to provide a structured process for achieving effective solutions. We present case studies of existing civic design initiatives and discuss challenges, limitations, and future work related to operationalizing, implementing, and testing this framework.
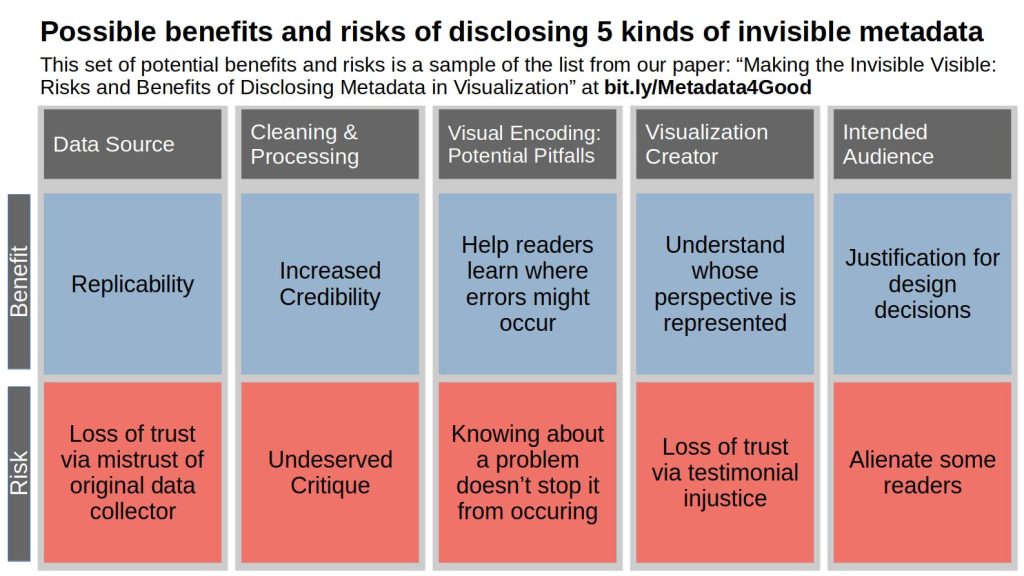
Making the Invisible Visible
Making the Invisible Visible
Led by: Alyx Burns
Related Papers: Making the Invisible Visible: Risks and Benefits of Disclosing Metadata in Visualization Vis4Good Talk
Accompanying a data visualization with metadata may benefit readers by facilitating content understanding, strengthening trust, and providing accountability. However, providing this kind of information may also have negative, unintended consequences, such as biasing readers’ interpretations, a loss of trust as a result of too much transparency, and the possibility of opening visualization creators with minoritized identities up to undeserved critique. To help future visualization researchers and practitioners decide what kinds of metadata to include, we discuss some of the potential benefits and risks of disclosing five kinds of metadata: metadata about the source of the underlying data; the cleaning and processing conducted; the marks, channels, and other design elements used; the people who directly created the visualization; and the people for whom the visualization was created. We conclude by proposing a few open research questions related to how to communicate metadata about visualizations.
If you are interested in working on or learning more about this project, please contact Alyx Burns at alyxanderbur@cs.umass.edu
CommunityClick-Virtual used by Amherst community during public hearing on December 2
In close collaboration with the Town of Amherst, on Dec 2, we invited the Amherst community to use CommunityClick-Virtual during a public hearing on Kendrick Park area changes in order to broaden and diversify public participation in civic processes.
Alyx Burns presented “Making the Invisible Visible” at the Vis4Good Workshop as a part of VIS 2021
Alyx Burns presented our short paper “Making the Invisible Visible: Risks and Benefits of Disclosing Metadata in Visualization” at the Visualization for Social Good workshop as a part of IEEE VIS 2021. For a summary of what was presented, see this summary slide or watch a video of his talk on YouTube.
Prof. Mahyar is serving as an Associate Chair for CHI 2022
Prof. Mahyar will be serving as the Associate Chair of the Visualization subcommittee for CHI 2022.
Paper by Prof. Mahyar to appear in ACM Journal for Digital Government
Prof. Mahyar’s new paper “A Framework for Open Civic Design: Integrating Public Participation, Crowdsourcing, and Design Thinking” was accepted to the ACM Journal for Digital Government: Research and Practice. Congratulations to Dr. Mahyar and her co-authors Brandon Reynante and Steven P. Dow.
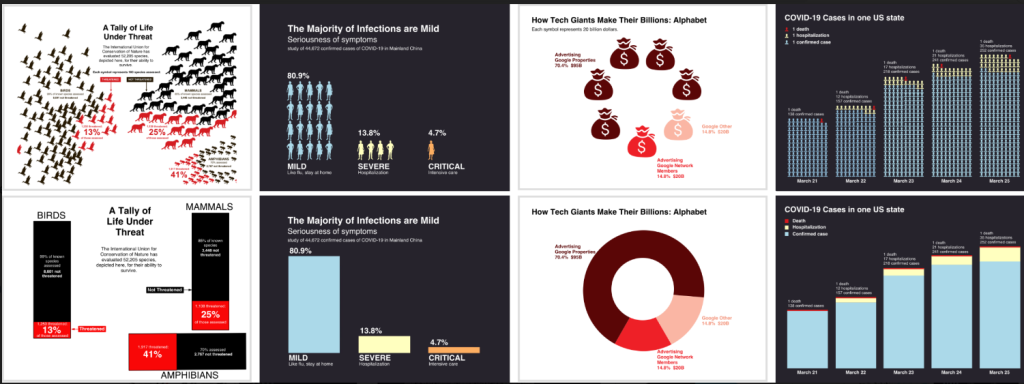
Designing with Pictographs
Designing with Pictographs
Led by: Alyx Burns
Related Papers: Designing with Pictographs: Envision Topics without Sacrificing Understanding
Past studies have shown that when a visualization uses pictographs to encode data, they have a positive effect on memory, engagement, and assessment of risk. However, little is known about how pictographs affect one’s ability to understand a visualization, beyond memory for values and trends. We conducted two crowdsourced experiments to compare the effectiveness of using pictographs when showing part-to-whole relationships. In Experiment 1, we compared pictograph arrays to more traditional bar and pie charts. We tested participants’ ability to generate high-level insights following Bloom’s taxonomy of educational objectives via 6 free-response questions. We found that accuracy for extracting information and generating insights did not differ overall between the two versions. To explore the motivating differences between the designs, we conducted a second experiment where participants compared charts containing pictograph arrays to more traditional charts on 5 metrics and explained their reasoning. We found that some participants preferred the way that pictographs allowed them to envision the topic more easily, while others preferred traditional bar and pie charts because they seem less cluttered and faster to read. These results suggest that, at least in simple visualizations depicting part-to-whole relationships, the choice of using pictographs has little influence on sensemaking and insight extraction. When deciding whether to use pictograph arrays, designers should consider visual appeal, perceived comprehension time, ease of envisioning the topic, and clutteredness.
If you are interested in working on or learning more about this project, please contact Alyx Burns at alyxanderbur@cs.umass.edu
Mahmood Jasim was awarded a Computing for Common Good Fellowship – Congratulations, Mahmood!
Mahmood Jasim was awarded a Computing for Common Good Fellowship by UMass CICS to develop a tool for inclusive public input collection and analysis.
Mahmood Jasim and Professor Narges Mahyar will work with the town of Amherst officials to design and develop CommunityClick-virtual — an online collaborative tool that combines machine learning, data visualization, and citizensourcing technology for inclusive public input collection and analysis. The project will enable people from all social backgrounds to equitably share their opinions on civic issues and allow the town officials to make sense of large-scale public input to inform themselves prior to making critical policy decisions.
Welcome to our 8 new lab members who joined this Fall!
The HCI-VIS lab is delighted to welcome 8 new members this fall, including 2 post-docs: Mennatullah Hendawy and Zhiqiu Jiang and 6 PhD students: Hamza Elhamdadi, Aimen Gaba, Prateek Mantri, Mashrur Rashik, Mahsa Sahebdel Alamdari, and Zack While.
We will additionally be joined by Swapna Joshi, who will begin her Post-Doc in the Spring.